-
A
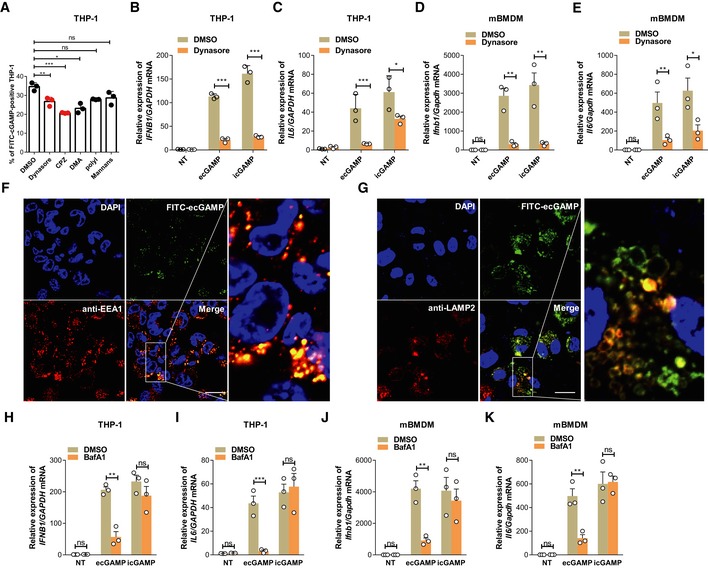
Frequencies of FITC+ THP‐1 cells stimulated with FITC‐ecGAMP for 1 h in the presence of DMSO or indicated inhibitors including dynasore (10 μM), chlorpromazine (CPZ, 10 μM), dimethylamiloride (DMA, 100 μM), polyinosinic acid (Poly I, 50 μg/ml), or mannans from Saccharomyces cerevisiae (mannans, 1 mg/ml).
-
B, C
qRT–PCR detection of IFNB1 (B) and IL6 (C) mRNA in THP‐1 cells stimulated with ecGAMP (5 μg/ml) or intracellular 2′3′‐cGAMP (icGAMP) (0.1 μg/ml) for 4 h in the presence of DMSO or dynasore (10 μM).
-
D, E
qRT–PCR detection of Ifnb1 (D) and Il6 (E) mRNA in mBMDMs stimulated with ecGAMP (5 μg/ml) or icGAMP (0.1 μg/ml) for 4 h in the presence of DMSO or dynasore (10 μM).
-
F, G
Immunostaining for EEA1 (red) (F) and LAMP2 (red) (G) in THP‐1 cells stimulated with FITC‐ecGAMP (5 μg/ml, green) for 30 min, nucleus in blue (DAPI). Data are representative of three independent experiments. Scale bars, 10 μm.
-
H–K
qRT–PCR detection of IFNB1 and IL6 mRNA in THP‐1 cells (H, I) and mBMDMs (J, K) stimulated with ecGAMP (5 μg/ml) and icGAMP (0.1 μg/ml), respectively, for 4 h in the presence of DMSO or bafilomycin A1 (BafA) (1 μM).
Data information: Data are means + SD (A–E, H–K) averaged from three independent experiments performed in technical triplicates, and each symbol represents mean of technical triplicates. One‐way ANOVA followed by Dunnett's
post hoc test (A) or two‐way ANOVA followed by Tukey's
post hoc test (B–E, H–K) was used for statistical analysis. *
P <
0.05; **
P <
0.01; ***
P <
0.001; ns, not significant.

