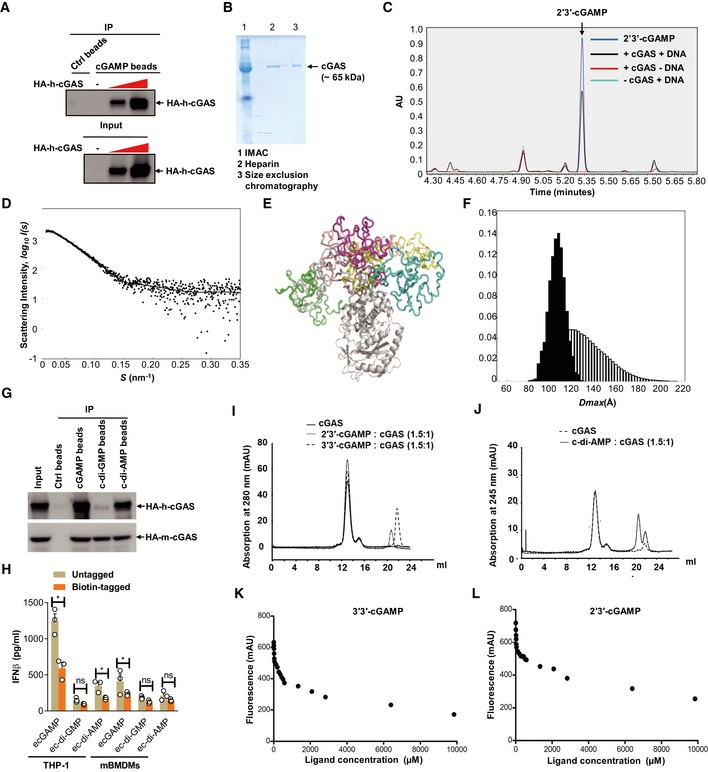
Figure EV3. Purification of cGAS and its binding to CDNs.

-
ALysates of HEK293T cells transfected with increasing amounts of HA‐cGAS were precipitated with control beads (Ctrl) or 2′3′‐cGAMP beads (cGAMP) and immunoblotted. Data are representative of three independent experiments.
-
BSDS–PAGE gel analysis of purified cGAS protein by indicated methods. IMAC, immobilized metal affinity chromatography. Data are representative of two independent experiments.
-
CEnzyme activity of purified cGAS confirmed by UPLC detection of cGAMP on a Waters BEH Amide Column. Data are representative of three independent experiments.
-
DThe small‐angle X‐ray scattering analysis of the full‐length apo‐cGAS. The EOM fit of the measured SAXS data. The goodness‐of‐the fit χ2 = 1.2.
-
EStructural alignment of the representative structures from cGAS apo EOM analysis.
-
FThe D max distributions (the maximum distance within a particle) derived from the EOM analysis of the measured SAXS profile (pool—the white histogram; the selected structures—the black histogram). The ensemble average of D max is 109.1 Å.
-
GLysates of HEK293T cells transfected with HA‐tagged human cGAS (HA‐h‐cGAS) or mouse cGAS (HA‐m‐cGAS) were precipitated with Ctrl beads or beads coupled with cGAMP, c‐di‐GMP, or c‐di‐AMP followed by immunoblotting.
-
HELISA detection of IFNβ release in the supernatant of THP‐1 cells stimulated with untagged or biotin‐tagged eCDNs (5 μM) including cGAMP, c‐di‐GMP, and c‐di‐AMP for indicated times. Data are means + SD averaged from at least three independent experiments performed with technical triplicates, where each symbol represents the mean of technical triplicates. Two‐way ANOVA followed by Bonferroni's post hoc test was used for statistical analysis, respectively. *P < 0.05; ns, not significant.
-
I, JElution profiles of analytical size exclusion chromatography (Superdex 200, GE Healthcare, 10/300 GL). Absorption profiles at 280 nm for detection of cGAS (solid lines) and cGAMPs (dashed lines) (I) and at 245 nm for c‐di‐AMP (J) are shown. Molecular stoichiometric ratios are indicated. Peak maximum at 13 ml (peak 1) corresponds to dimeric cGAS with a molecular mass of about 120 kDa. Despite the presence of free CDNs (Peaks 2–4), the specific interaction (coelution) of cGAS with CDNs was evident in each case by an increased peak intensity of 36% (2′3′‐cGAMP), 17% (3′3′‐cGAMP), and 2% (c‐di‐AMP), respectively. mAU, milli absorbance units. Data are representative of three independent experiments.
-
K, LFluorometry assay to detect the binding of 3′3′‐cGAMP (K) or 2′3′‐cGAMP (L) with purified cGAS. Data are representative of at least three independent experiments.
Source data are available online for this figure.
