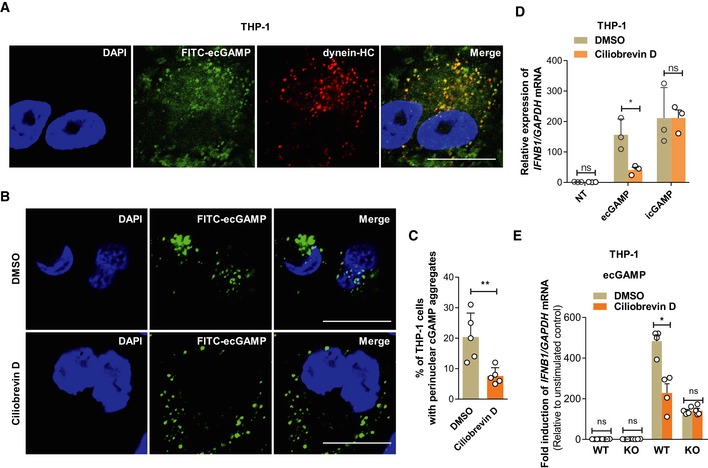
Immunostaining of dynein heavy chain (HC) (red) in THP‐1 cells stimulated with FITC‐ecGAMP (5 μg/ml, green) for 2 h, nucleus in blue (DAPI). Data are representative of three independent experiments. Scale bar, 10 μm.
Cellular localization of ecGAMP in THP‐1 cells stimulated with FITC‐ecGAMP (5 μg/ml, green) for 2 h in the presence of DMSO or dynein inhibitor ciliobrevin D (50 μM), nucleus in blue (DAPI). Data are presentative of five independent experiments. Scale bar, 10 μm.
Frequency of perinuclear accumulation of 2′3′‐cGAMP in THP‐1 cells stimulated with FITC‐cGAMP (2 μg/ml) for 2 h in the presence of DMSO or dynein inhibitor ciliobrevin D (50 μM). Data are means + SD averaged from five independent experiments, and approximately 100 cells were imaged and counted in each experiment. Each symbol represents the percentage of THP‐1 cells with perinuclear cGAMP aggregates in every independent experiment. Mann–Whitney U‐test was used for statistical analysis. **P < 0.01.
qRT–PCR detection of IFNB1 mRNA in THP‐1 cells stimulated with ecGAMP (5 μg/ml) or icGAMP (0.1 μg/ml) for 4 h in the presence of DMSO or ciliobrevin D (50 μM).
qRT–PCR detection of IFNB1 mRNA abundance in WT and cGAS KO THP‐1 cells stimulated with ecGAMP (5 μg/ml) for 4 h in the presence of DMSO or ciliobrevin D (50 μM).
Data information: Data are means + SD (C–E) averaged from at least three independent experiments performed with technical triplicates. Each symbol represents the mean of technical triplicates. Two‐way ANOVA followed by Bonferroni's
post hoc test was used for statistical analysis (C–E). *
P <
0.05; **
P < 0.01; ns, not significant.

