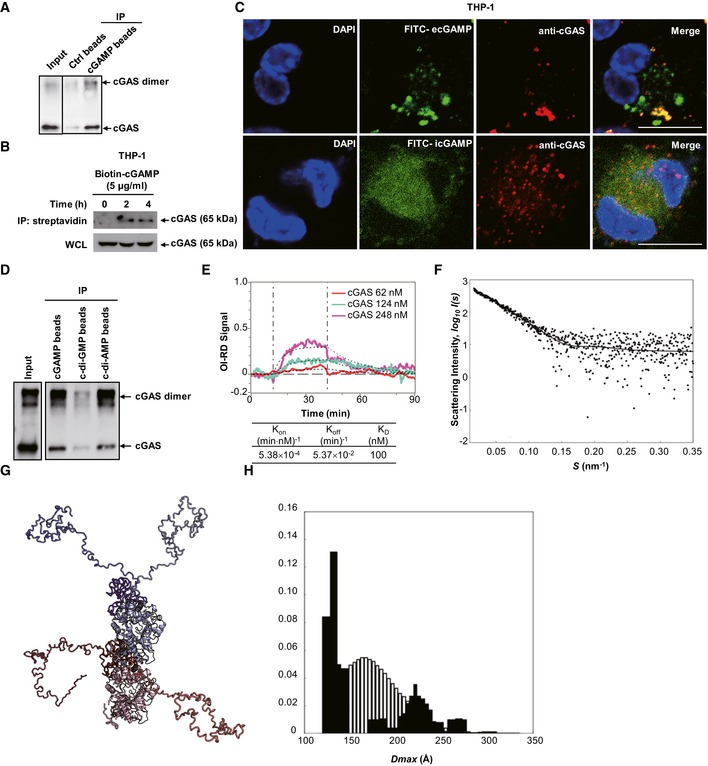
Purified h‐cGAS protein was precipitated with Ctrl beads or cGAMP beads and then immunoblotted.
THP‐1 cells were stimulated with biotin‐cGAMP for indicated times, and then, whole‐cell lysates (WCL) were precipitated with streptavidin beads followed by immunoblotting.
Immunofluorescent staining of cGAS (red) in THP‐1 cells treated with FITC‐ecGAMP (5 μg/ml) (green) or FITC‐icGAMP (0.1 μg/ml) (green) for 4 h, nucleus in blue (DAPI). Scale bar, 10 μm.
Purified h‐cGAS protein was precipitated with beads coupled with cGAMP, c‐di‐GMP, or c‐di‐AMP followed by immunoblotting.
Binding curves of surface‐immobilized 2′3′‐cGAMP with His‐cGAS at indicated concentrations. Vertical lines mark the start of association and dissociation phases of the binding events. The dashed lines are global fits to a Langmuir reaction model; global fitting parameters are listed in the table below the plot (n = 4 independent experiment).
The small‐angle X‐ray scattering analysis of the full‐length cGAS with cGAMP. The EOM fit of the measured SAXS data. The goodness‐of‐the fit χ2 = 1.1.
Structural alignment of the representative structures from cGAS‐cGAMP EOM analysis. cGAMP subunits are colored red and blue, respectively. Different conformations of the cGAS N‐termini are highlighted in additional shades of red and blue.
The D
max distributions (the maximum distance within a particle) derived from the EOM analysis of the measured SAXS profile (pool—the white histogram, the selected structures—the black histogram). The distribution of the selected structures shows a bimodal behavior with an average value of 166.9 Å.
Data information: Data (A–E) are representative of at least three independent experiments.