-
A, B
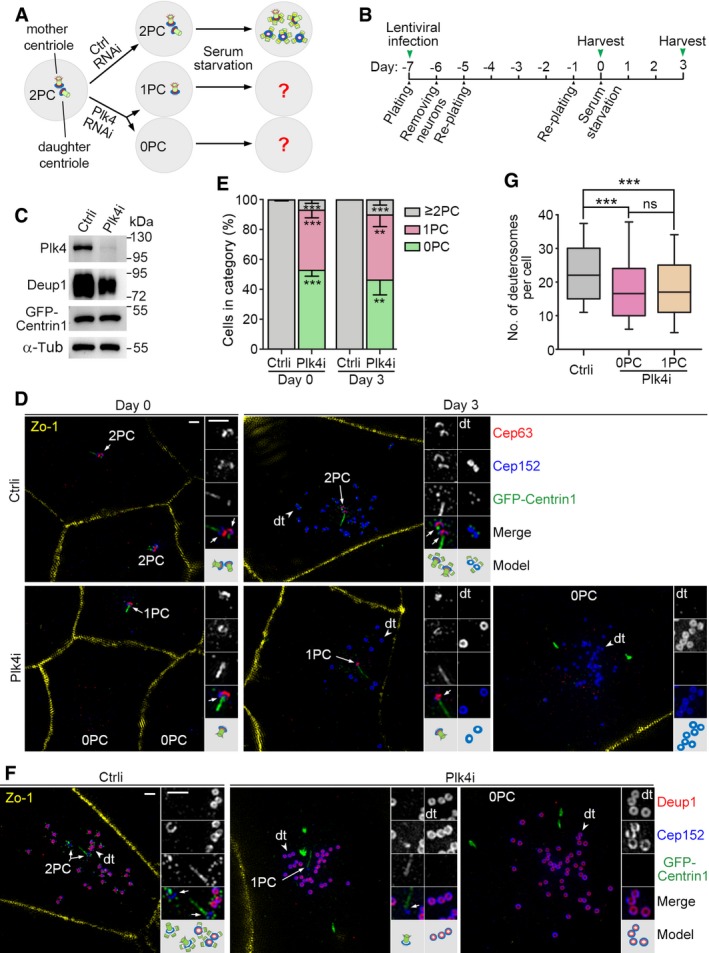
Experimental design. Depletion of Plk4 will abolish centriole biogenesis and result in loss of one (1PC) or both (0PC) of the two parental centrioles (2PC) during the proliferation of ependymal progenitor cells, which can then be used to examine how parental centrioles contribute to the deuterosome formation (A). We transfected the progenitors prepared from P0 mouse brain tissues with lentiviral particles at day −7 to silence Plk4 expression and examined their progeny cells at day 0 and 3 (B).
-
C
Confirmation of the Plk4 RNAi efficiency using mEPCs at day 3. The reduced expression of Deup1 in the Plk4‐depleted cells is attributed to reduced multiciliate cell differentiation.
-
D
Typical cells immunostained for Zo‐1, Cep152, and Cep63. GFP‐Centrin1 expressed from the lentiviruses served as both infection and centriole markers. The green fluorescence was enhanced using anti‐GFP antibody and Alexa Fluor‐488‐conjugated secondary antibody. Parental centrioles (arrows) and representative deuterosomes (dt; arrowheads) are magnified twofold to show details. An illustration is provided for each set of the magnified images. Parental centrioles were identified based on the co‐staining patterns of Cep63, Cep152, and GFP‐Centrin1. The strong GFP‐Centrin1‐positive streaks or speckles in the Plk4‐depleted cells are not considered as centrioles because they did not co‐stain with other centriolar markers. Scale bar, 1 μm.
-
E
Parental centriole contents of the cells. The histograms represent mean values from three independent experiments. At least 186 cells at days 0 and 80 and deuterosome‐containing cells at day 3 were examined in each experiment and condition. Parental centrioles were identified based on the co‐staining patterns of at least two different centriolar markers. Error bars represent SD. Two‐tailed paired Student's t‐test, **P < 0.01; ***P < 0.001.
-
F
Confirmation of deuterosome formation in Plk4i‐expressing mEPCs at day 3 by co‐staining for Deup1 and Cep152. Parental centrioles (arrows) and representative deuterosomes (dt; arrowheads) are magnified twofold to show details. Scale bar, 1 μm.
-
G
Box plots for deuterosome numbers per cell. At least 156 deuterosome‐containing cells from three independent experiments were examined. Deuterosomes were scored as ring‐shaped structures decorated by both Deup1 and Cep152 (F) or by Cep152 but excluding parental centrioles (E). The bottom and top of the box represent the 25th and 75th percentiles, respectively. The band is the median. The ends of the whiskers indicate the 10th and 90th percentiles of the data. Two‐tailed unpaired Student's t‐test: ns, no significance; ***P < 0.001.

