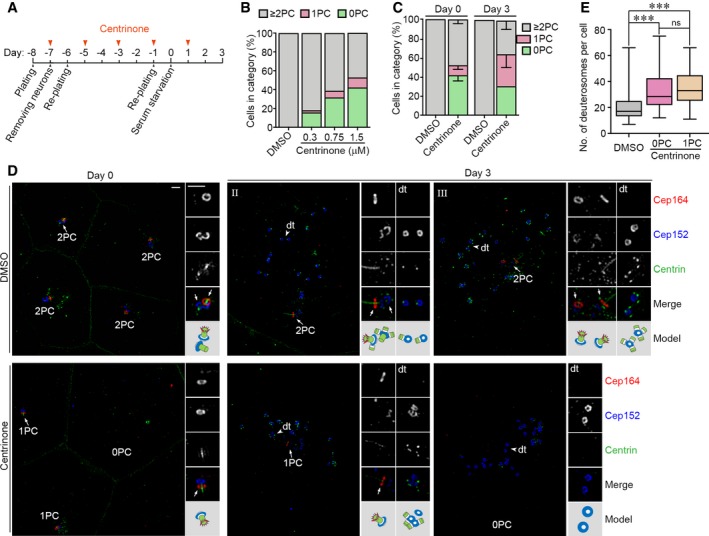
Experimental design.
Effects of different centrinone concentrations on parental centrioles. Mouse ependymal progenitors treated as in (A) with 0.3–3.0 μM centrinone were fixed at day 0 and immunostained as in (D). Parental centrioles were identified based on the co‐staining patterns of Cep152, Centrin, and Cep164. The histograms represent mean values from one experiment, and at least 89 cells were scored in each condition. The cells treated with 3.0 μM of centrinone died massively and were not analyzed.
Parental centriole contents of the cells treated with 1.5 μM centrinone, based on the co‐staining patterns of Cep152, Centrin, and Cep164 (D). The histograms represent mean values from three independent experiments, and at least 482 cells at days 0 and 100 deuterosome‐containing cells at day 3 were scored in each experiment and condition. Error bars represent SD.
Typical cells treated with DMSO or centrinone, immunostained for Cep152, Cep164, Centrin, and Zo‐1. Zo‐1 and Centrin were immunostained in the same channel because their antibodies were both from mouse and their staining patterns did not overlap. Magnified images (2×) show details of representative parental centrioles (arrows) and deuterosomes (dt; arrowheads). An illustration is provided for each set of the magnified images. Scale bar, 1 μm.
Box plots for deuterosome numbers per cell at day 3. Deuterosomes were scored as ring‐shaped structures decorated by Cep152 but excluding parental centrioles (D). At least 100 deuterosome‐containing cells from three independent experiments were scored. The bottom and top of the box represent the 25th and 75th percentiles, respectively. The band is the median. The ends of the whiskers indicate the maximum and minimum of the data. Two‐tailed unpaired Student's t‐test: ns, no significance; ***P < 0.001.

