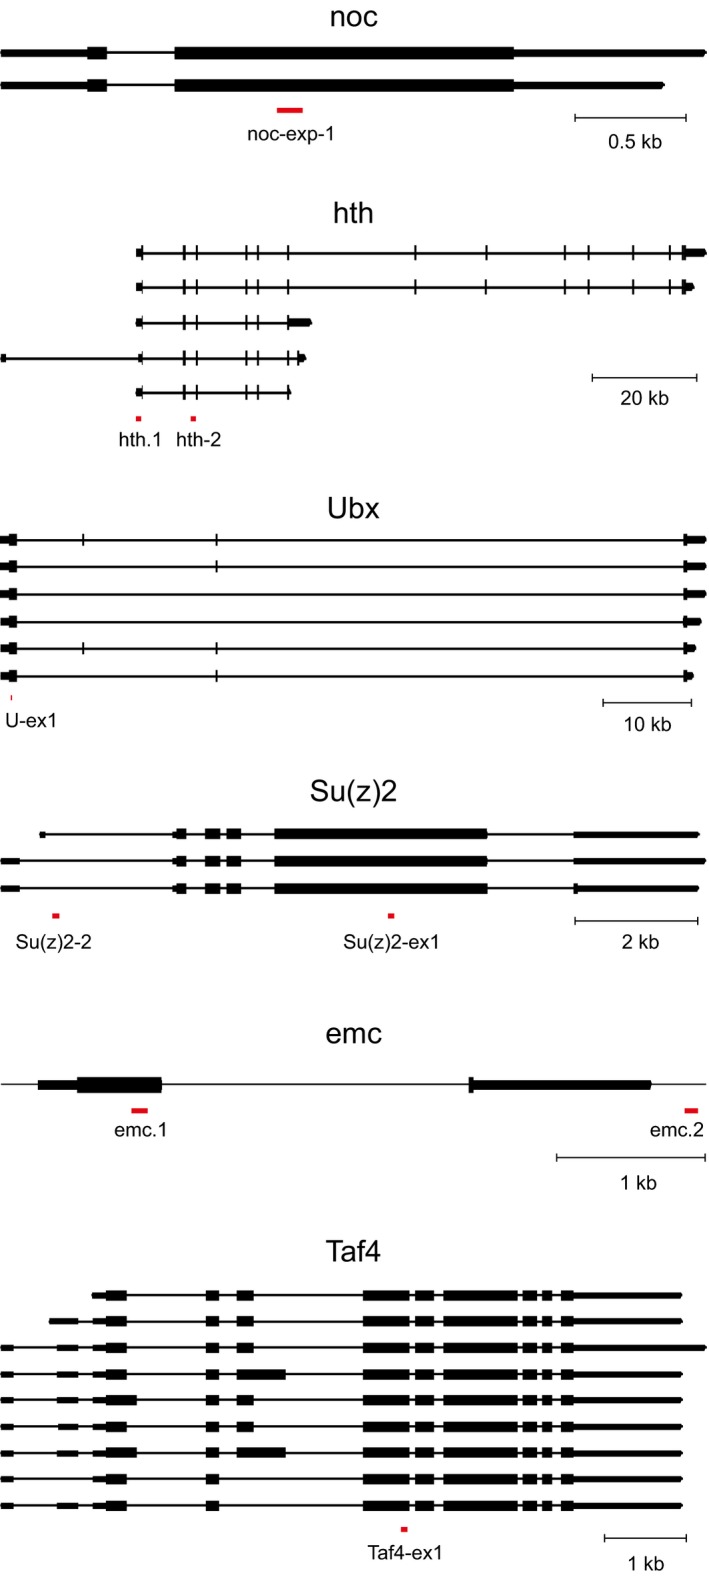
Figure EV3. Schematic of target genes selected for ChIP‐qPCR analyses.

Gene exons are shown as thick boxes for coding parts and thin boxes for 5′‐ and 3′‐UTRs, the introns are indicated with strait lines. All isoforms are listed. The schematics are drawn to scales indicated with scale bars below each gene. The positions of PCR amplicons used for the analyses are marked with red boxes.
