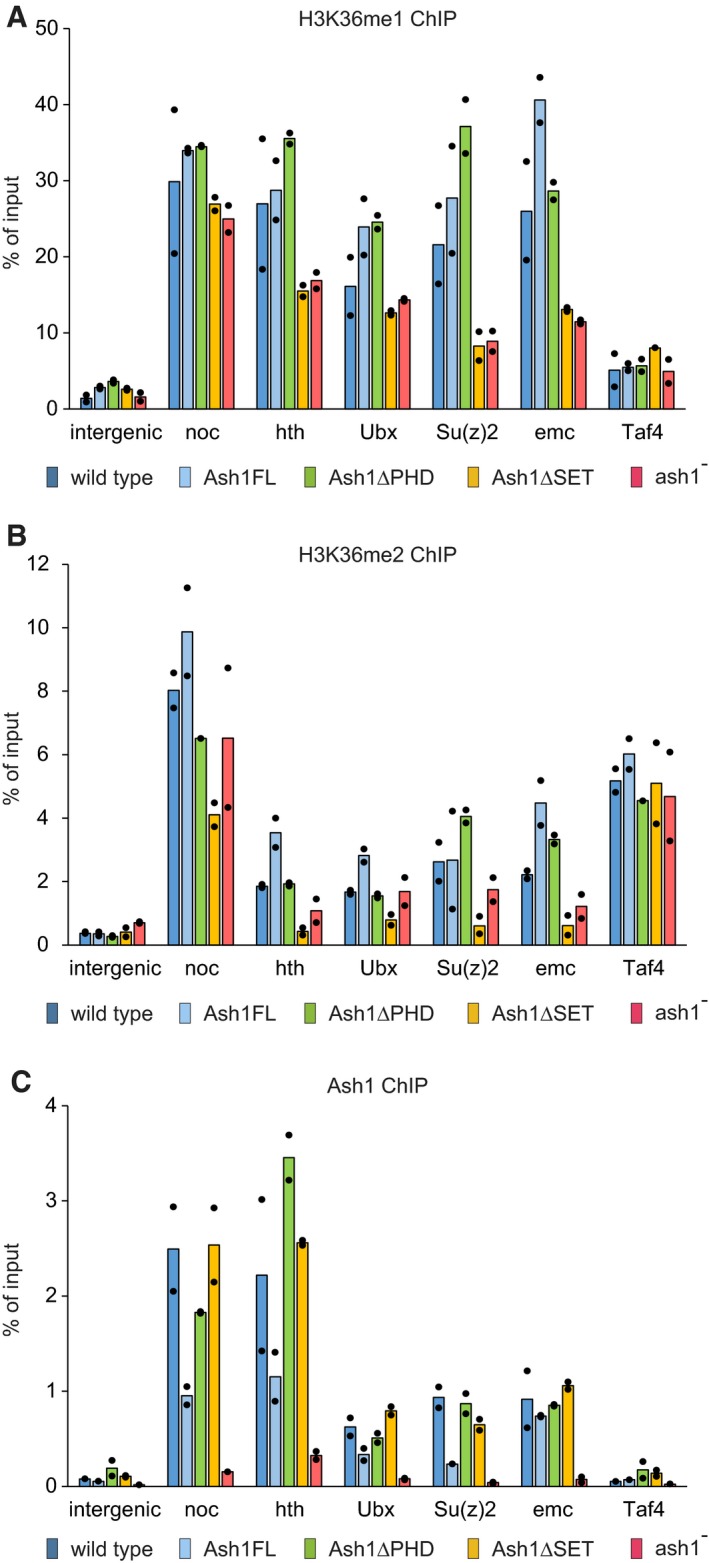
Figure 4. ChIP and quantitative PCR (ChIP‐qPCR) analysis of H3K36 methylation and Ash1 binding.

-
A–CChromatin from the wild‐type (dark blue bars), ash1 22/ash1 9011 (ash1−, red bars) and transgenic ash1 22/ash1 9011 (Ash1FL, light blue bars; Ash1ΔPHD, green bars; Ash1ΔSET, orange bars) larvae was subjected to immunoprecipitation with the antibodies against H3K36me1 (A), H3K36me2 (B) and Ash1 (C). Histograms show the mean of the two independent experiments (n = 2) with dots indicating individual experimental results. An intergenic region on chromosome 3R (intergenic) and the constitutively active TBP‐associated factor 4 (Taf4) gene serve as controls. The loss of Ash1 ChIP signal in the ash1 − larvae indicates that the selected genes are the genuine Ash1 binding sites.
