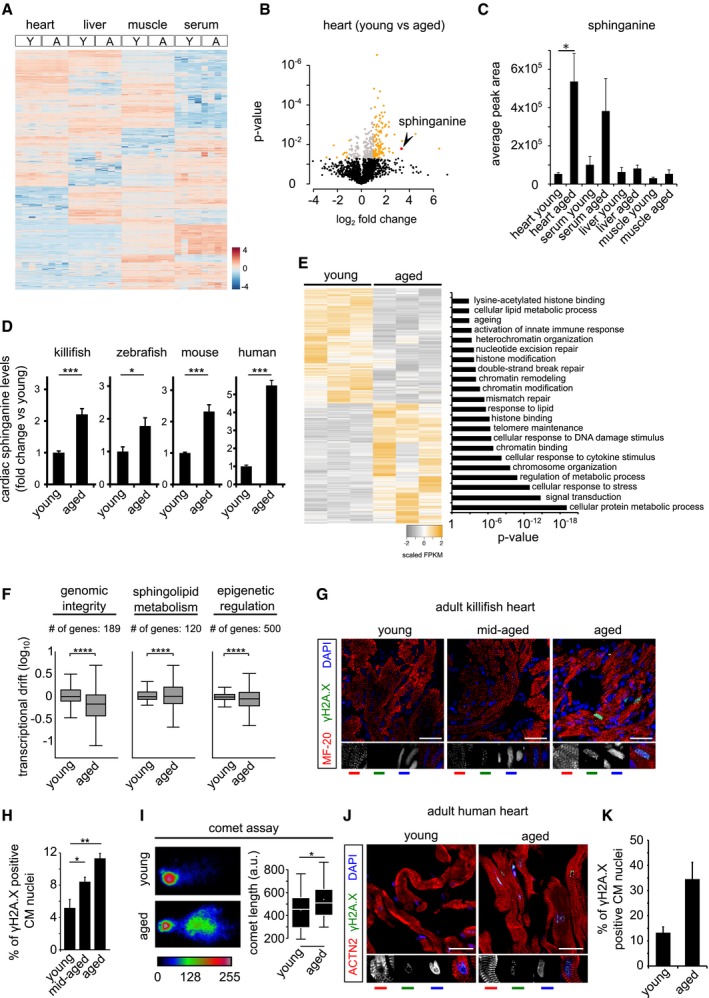
Heatmap of differentially enriched metabolites in heart, liver, skeletal muscle and serum of young (Y) and aged (A) killifish (n = 4). Color scale represents scaled enrichment values.
Ageing leads to significant cardiac‐specific accumulation of sphinganine. Volcano plot depicting the (de)enrichment profiles of all the identified metabolites in the heart, with sphinganine indicated by an arrowhead. Metabolites depicted in orange colour are the significantly altered metabolites with age in the heart (Log2 fold change ≥ 1 or ≤ −1; P‐value < 0.05); Student's t‐test was used to compute statistical significance.
Bar graph depicting the relative abundance of sphinganine in indicated tissue from young and aged killifish.
Targeted lipidomics confirm age‐dependent accumulation of sphinganine in killifish (n = 4; per condition, young = 6 weeks and aged = 12 weeks), zebrafish (n = 4, per condition, young = 7 months and aged = 26 months), mouse (n = 4 for young and n = 6 for aged samples, young = 21–23 weeks and aged = 131–143 weeks) and human hearts (n = 1 for young and 2 for aged, young = 30 years and aged = 61 and 64 years). In the case of human heart tissue, statistical significance was computed from technical replicates.
Heatmap of differentially expressed transcripts (Log2 fold change ± 1, P‐value cut‐off < 0.05) between young and aged killifish hearts (n = 3). Significantly enriched relevant GO categories depicted as bar graph.
Transcriptional drift variance of genes involved in genome integrity, epigenetic regulation and sphingolipid metabolism. Data are represented as box‐plot, and Levene's test was used for the estimation of the statistical significance. Error bars represent drift‐variance. Box plot whiskers show 1.5 IQR of highest and lowest quartile. Horizontal line within the bars represent median of the underlying population.
γH2A.X staining of young, mid‐aged and aged killifish hearts show signs of DNA damage, increasing with age (n = 4, no. of sections per animal = 10 alternate sections, 10 μm thickness).
Quantification of γH2A.X+ cardiomyocyte nuclei.
The aged killifish hearts show significant signs of genome instability shown here by neutral comet assays. Representative images of single nuclei from young and old hearts along with comet length on the right (n = 4).
γH2A.X staining of young and aged human ventricles shows signs of DNA damage accumulating with age (n = 2, no. of sections per sample = 5 alternate sections, 10 μm thickness).
Quantification of γH2A.X+ cardiomyocyte nuclei is on the right.
Data information: ACTN2 and MF‐20 are used to specifically label cardiomyocytes from human and fish, respectively. When not specified, the experiments were conducted in at least three biological replicates. Error bars in panels (C, D, H and K) represent standard error of the mean. For pairwise comparisons, Student's
t‐test was performed. In case of transcriptional drift analysis, Levene's test was used for the estimation of the statistical significance.
P‐value cut‐off used for computing statistical significance is ≤ 0.05. *, **, *** and **** in the figure refer to
P‐values ≤ 0.05, ≤ 0.01, ≤ 0.001 and ≤ 0.0001, respectively. Statistically non‐significant comparisons are annotated as ns. Scale bars = 50 μm.

