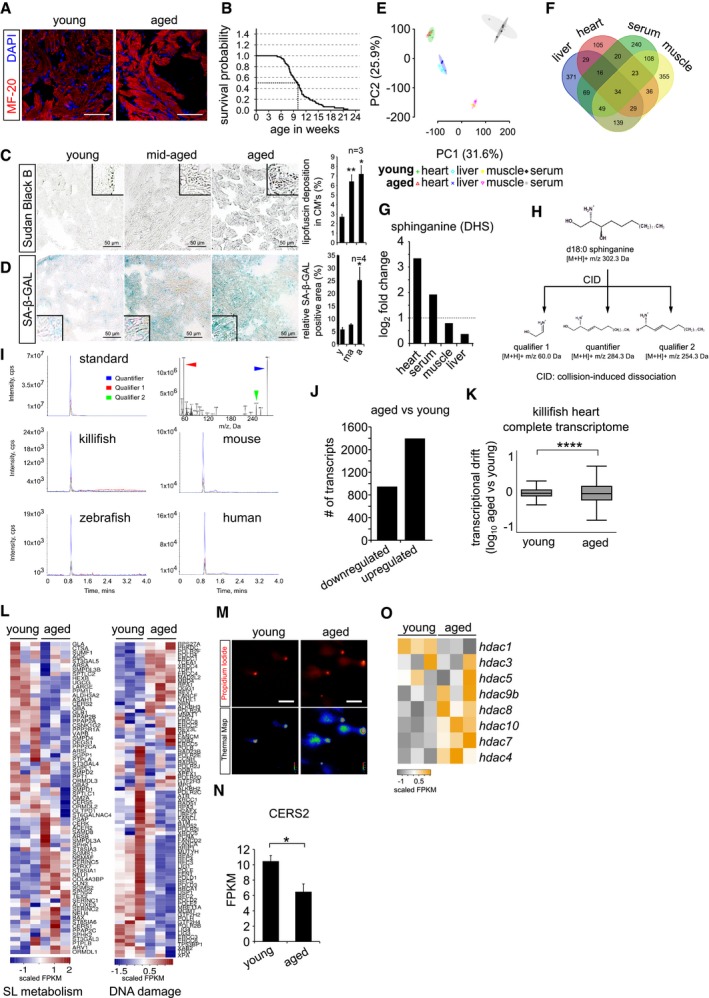
Immunohistochemistry on 10 μm cryosections of young (6 weeks) and aged (12 weeks) killifish ventricular tissue with cardiac marker MF‐20. Cardiomyocyte sarcomeres are labelled with MF‐20 (red).
Kaplan–Meier analysis representing the survival of GRZ‐AD killifish strain used in this study. The median lifespan of killifish in laboratory condition is ˜ 9.5 weeks, indicated as stripped line (n = 170).
Lipofuscin staining by Sudan Black B on 5 μm paraffin sections of different ages of killifish heart. Lipofuscin granules are labelled in grey‐black colour. The bar graph on right represents the percentage area of the ventricular region acquired by lipofuscin granule with respect to total tissue area. Quantification was performed on a total of 12 sections per condition, covering independent regions of the ventricle. Number of animals = 3 per condition. Insets represent magnified view of the ventricles.
Senescence detection based on SA‐beta‐galactosidase activity in ageing killifish hearts. Blue/cyan colour represents the positive regions in the ventricular sections. The bar graph on right represents percentage of SA‐β‐GAL‐stained area with respect to the total ventricle area. Quantification was performed on a total of 12 sections per condition, covering different regions of the ventricle. Number of animals = 4 per condition. Insets represent magnified view of the ventricle.
Principal component analysis of all the metabolites detected in various tissue samples. Number of animals = 4 per condition.
Venn diagram of all the detected metabolites by untargeted metabolomics. Number of animals = 4 per condition.
Bar graph depiction of the relative abundance of sphinganine levels in various killifish tissues obtained from untargeted metabolomics n = 4, each condition. Log2 fold enrichment represents the relative abundance of sphinganine in aged tissues in comparison with young ones.
Graphical illustration of collision‐induced dissociation of standard sphinganine d18:0, resulted in 2 qualifiers and 1 quantifier. Mass by charge ratios (m/z) of corresponding fragments are mentioned underneath.
Spectral peaks of both qualifiers (in red and green) and a quantifier (in blue) obtained from dissociation of standard sphinganine and of aged heart tissues from killifish, zebrafish, mouse and humans.
Bar graph depicting the number of up and downregulated genes in the killifish ventricles upon ageing (n = 3 animals per condition).
Transcriptional drift variance of all the detected transcripts in young and aged killifish hearts. Data are represented as box‐plot, and Levene's test was used for the estimation of the statistical significance. Error bars represent drift‐variance. Box plot whiskers show 1.5 IQR of highest and lowest quartile. Horizontal line within the bars represent median of the underlying population.
Heatmap representation of the hallmark genes of sphingolipid metabolism and DNA damage pathways shows differential expression in young and aged killifish hearts. Scale bar represents scaled FPKM (Fragments Per Kilobase of transcript per Million mapped reads), to graphically represent expression levels of the indicated genes, on a scale given scale.
Micrographs of comet assay on isolated killifish cardiomyocytes from young and old individuals n = 4, each condition.
Bar graph illustrating the absolute transcript expression of ceramide synthase 2 between young and aged killifish ventricles, n = 3 per condition. Expression levels are depicted in FPKM (Fragments Per Kilobase of transcript per Million mapped reads).
Heatmap with scaled FPKM values of all detected histone deacetylase genes, which are differentially expressed in the killifish transcriptome. Scale bar represents scaled FPKM, to graphically represent expression levels of the indicated genes on a scale given scale.
Data information: When not specified, the experiments were conducted in at least three biological replicates. Error bars in panels (C, D and N) represent standard error of the mean. For pairwise comparisons, Student's
‐test was performed for the estimation of the statistical significance.
‐value cut‐off used for computing statistical significance is < 0.05. *, ** and **** in the figure refer to
‐values ≤ 0.05, ≤ 0.01 and ≤ 0.0001, respectively. Statistically non‐significant comparisons are annotated as ns. Scale bars = 50 μm.

