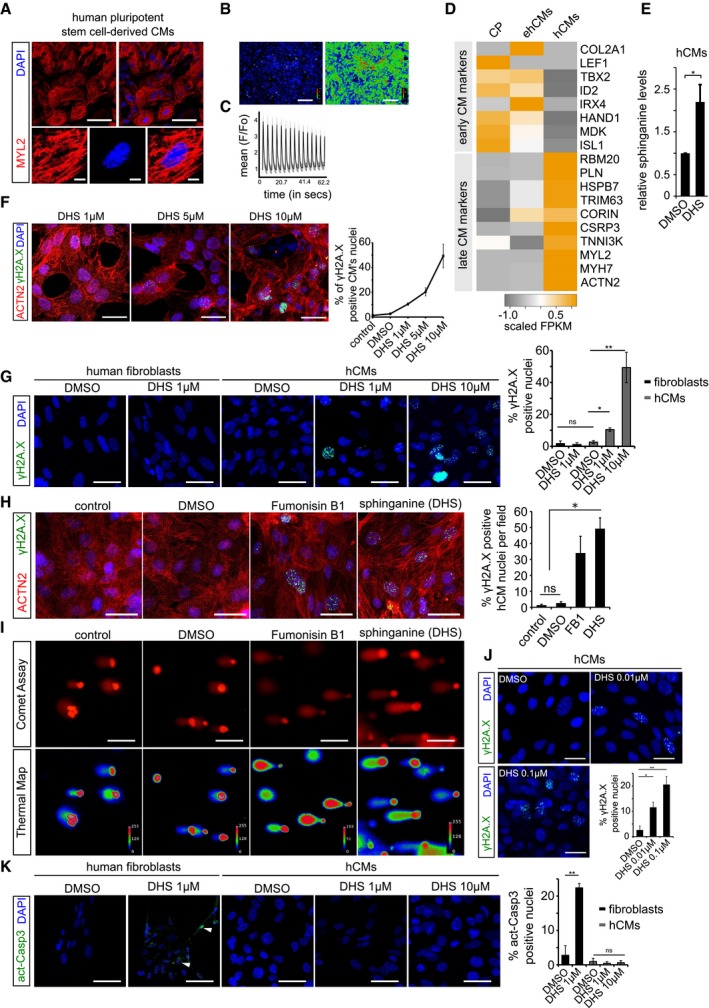
Human pluripotent stem cell‐derived cardiomyocytes (hCMs) express ventricle‐specific marker MYL2 (red); insets show a magnified single cardiomyocyte.
Calcium response in post‐mitotic hCMs. Left and right panel depicts basal and excitation states of hCMs, respectively.
Graphical depiction of ratiometric measurement of fluorescence from different ROI (region of interest). Fluorescence intensities from the indicated ROIs (faint red circles) were measured (F) and normalized to basal fluorescence levels (Fo). The normalized data points (F/Fo) were plotted over time.
Heatmap depicting expression profile of early and late cardiomyocytes markers during key time points of differentiation. CP (cardiac progenitors), ehCMs (early human cardiomyocytes) and hCMs (human cardiomyocytes). Scale bar represents scaled FPKM, to graphically represent expression levels of the indicated genes, on a scale of −1 to +1.
Exogenous treatment of hCMs with 10 μM DHS leads to significant increase in intracellular DHS levels in comparison with DMSO control. Experiment was performed in biological triplicate.
Dose‐dependent increase in γH2A.X+ nuclear foci in hCMs upon DHS exposure. hCMs were pre‐incubated for 3 days with either 1, 5 μM or 10 μM of DHS. The graph on the right represents quantifications from n = 3 experiments. ACTN2 is used to specifically label human cardiomyocytes (red).
Elevated DHS levels induce DNA damage in hCMs but not in human primary fibroblasts shown here by immunostaining for γH2A.X (green). Bar graph on the right represents percentage of γH2A.X+ positive nuclei per condition. These experiments were performed in biological triplicate, and a total of ˜ 170 cells were quantified.
Human cardiomyocytes were pre‐incubated for 3 days with either DMSO, 10 μM Fumonisin B1 or 10 μM sphinganine (DHS), and the induction of DNA damage was assayed by immunostaining for γH2A.X (green). Bar graph to the right depicts the percentage of γH2A.X positive nuclei in the indicated conditions. (n = 3 biological replicates; number of cells quantified per replicate = 150–200). ACTN2 is used to specifically label human cardiomyocytes (red).
Representative micrographs depicting the results of comet assay in the indicated conditions.
Chronic exposure of hCMs with lower concentrations of sphinganine (0.01 and 0.1 μM) for 7 days induces signs of DNA damage shown here by γH2A.X immunostaining. Bar graph represents percentage of positive nuclei per condition.
Elevated DHS levels cause apoptosis in human primary fibroblasts but not in hCMs shown here by immunostaining with active caspase‐3 (green). White arrowheads indicate the active caspase‐3‐stained regions. Bar graph on the right represents percentage of active caspase‐3‐positive cells in the indicated conditions. Experiment was performed in biological triplicate, and a total of ˜ 150 cells were quantified per condition.
Data information: When not specified, the experiments were conducted in at least three biological replicates. Error bars in panel (E, F, G, H, J and K) represent standard error of the mean. For pairwise comparisons, Student's
t‐test was performed for the estimation of the statistical significance.
P‐value cut‐off used for computing statistical significance is < 0.05. * and ** in the figure refer to
P‐values ≤ 0.05 and ≤ 0.01, respectively. Statistically non‐significant comparisons are annotated as ns. Scale bars = 10 μm, except for panel (I) 50 μm and for insets 5 μm.

