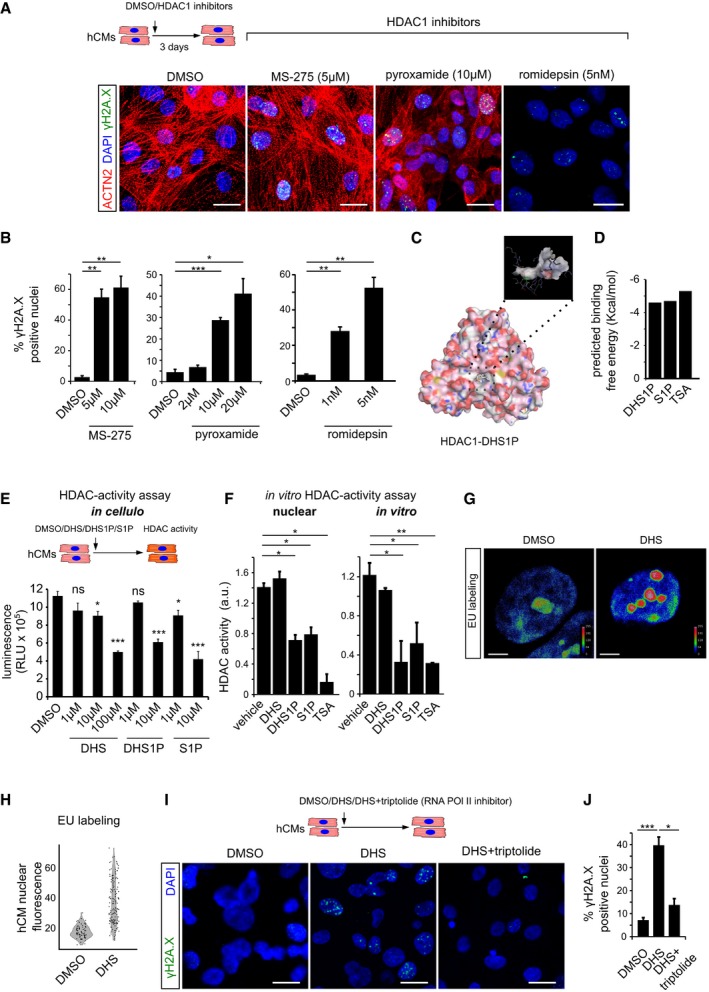
Pharmacological inhibition of HDAC1 using romidepsin, MS‐275 and pyroxamide in human cardiomyocytes causes extensive DNA damage, shown here by γH2A.X staining. ACTN2 is used to specifically label human cardiomyocytes.
Bar graphs depict quantification of γH2A.X+ hCM nuclei in the indicated conditions. Data represent measurements from ˜ 100 to 200 cells per condition, derived from three biological replicates.
In silico simulation showed docking of sphinganine‐analogue DHS1P in the tubular active site of human HDAC1.
Sphinganine derivatives DHS1P and S1P show comparable binding affinity to HDAC1, similar to the known HDAC inhibitor TSA.
Sphinganine and its derivative DHS1P inhibits class 1 HDACs in the human cardiomyocytes as inferred from the in cellulo HDAC activity assay, shown here as bar graph. Data represent measurements from four biological replicates.
In vitro HDAC activity assay revealed inhibition of nuclear HDACs and purified HDAC1 activity by DHS1P and S1P, shown here as bar graphs. Data represent measurements from three independent replicates.
Representative micrographs depicting the increase in nascent transcripts upon DHS treatment of hCMs, measured by EU labelling assay. Micrographs are depicted as a thermal map derived from greyscale images. Scale represents the relative EU labelling intensities within the nucleus, ranging from red colour (higher intensity) to blue colour (lower intensity).
Quantitative assessment of transcription levels measured by EU labelling assay upon treatment with DHS on hCMs. Quantification represents measurements of ˜ 80–120 single nuclei per condition, derived from three biological replicates.
Representative micrographs of hCMs indicating the rescue of the DHS‐induced DNA damage by co‐incubation with RNA Pol II inhibitor, triptolide.
Quantifications of γH2A.X+ CM nuclei represented as bar graph (n = 3 biological replicates).
Data information: When not specified, the experiments were conducted in at least three biological replicates. Error bars in panel (B, E, F and J) represent standard error of the mean. For pairwise comparisons, Student's
t‐test was performed for the estimation of the statistical significance. For the comparison of fluorescence signal intensities (panel H), KS‐test was used as a measure of statistical significance.
P‐value cut‐off used for computing statistical significance is < 0.05. *, ** and *** in the figure refer to
P‐values ≤ 0.05, ≤ 0.01 and ≤ 0.001, respectively. Statistically non‐significant comparisons are annotated as ns. Scale bars for (A, I) = 10 μm and (G) = 50 μm.

