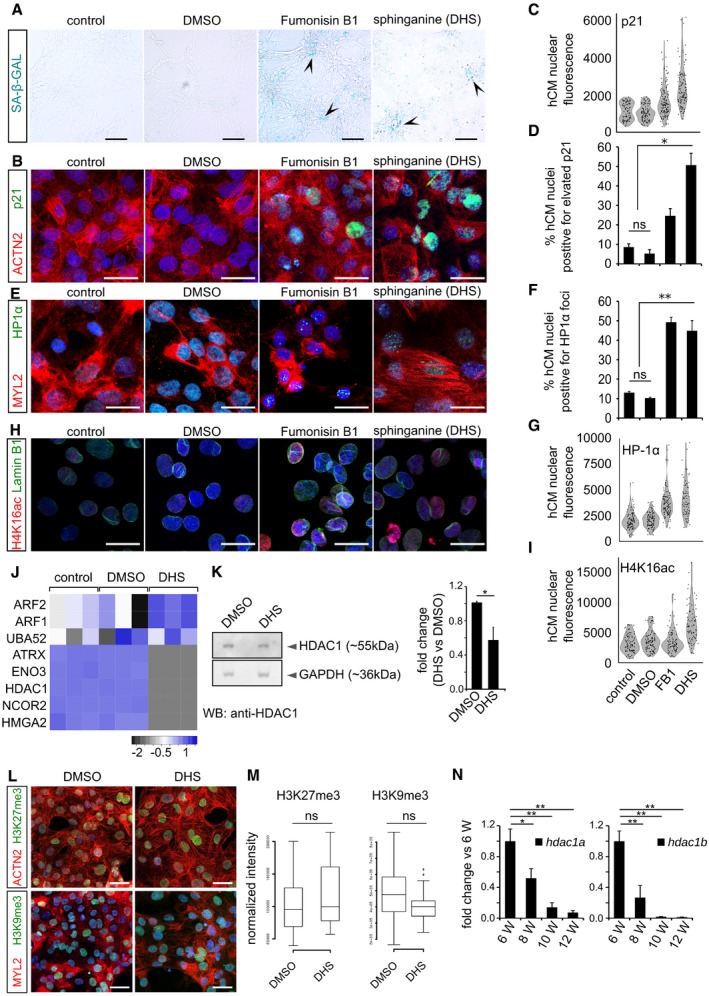
Elevated DHS levels in hCMs induce signature of cellular senescence indicated here by representative micrographs from SA‐beta‐galactosidase staining (blue/cyan colour represents the positive regions). Arrowheads in the representative panels indicate the SA‐beta‐galactosidase‐stained regions.
Elevated DHS levels in hCMs induce p21 expression indicated here by representative micrographs from p21 immunostaining (in green). ACTN2 is used to specifically label human cardiomyocytes.
Violin plot depicting the distributions of the greyscale nuclear intensity of the indicated markers. n = 3 biological replicates; number of fields evaluated per condition = 12; total number of cells quantified per replicate = 150–200).
Bar graph representing the percentage of hCMs nuclei harbouring elevated p21 levels. n = 3 biological replicates; number of fields evaluated per condition = 12; total number of cells quantified per replicate = 150–200).
Elevated DHS levels lead to HP1‐α+ nuclear loci in hCMs. MYL2 is used to specifically label cardiomyocytes (red).
Bar graph depicting the percentage positive nuclei HP1‐α foci in human cardiomyocytes (n = 3 biological replicates; number of fields evaluated per condition = 9; number of cells quantified per replicate = 120–200).
Violin plot depicting the distributions of the greyscale nuclear intensity of the indicated markers (n = 3 biological replicates; number of fields evaluated per condition = 9; number of cells quantified per replicate = 120–200).
DHS exposure leads to significant increase in H4K16ac (in red) levels accompanied by nuclear envelope defects (Lamin B1 immunostaining in green) of cardiomyocytes.
Violin plot depicting the distributions of the greyscale nuclear intensity of the indicated marker (n = 3 biological replicates; number of cells quantified per replicate = 100–150).
Heatmap depicting the relative enrichment/de‐enrichment of the indicated proteins as inferred from label‐free proteomics analysis.
Western blot analysis revealed decreased levels of HDAC1 protein in the DHS‐treated human cardiomyocytes. Quantifications are on the right.
DHS exposure of hCMs does not alter the levels of H3K27me3 and H3K9me3. ACTN2 or MYL2 is used to specifically label human cardiomyocytes.
Box‐plot representing the normalized nuclear intensities of H3K27me3 and H3K9me3. Extremes of the error bars represent non‐outlier range, and their length represents the variability within the data. Horizontal line within the bars represents median of the underlying population. Box plot whiskers show 1.5 IQR of highest and lowest quartile, outliers are included (dots). Extremes of the error bars represent non‐outlier range and their length represents the variability within the data. Horizontal line within the bars represent median of the underlying population.
Bar graphs representing the decline in the transcript levels of hdac1a (left) and hdac1b (right) in the killifish ventricles as inferred by RT–qPCR. X‐axis represents fish age in weeks (annotated as W).
Data information: When not specified, the experiments were conducted in at least three biological replicates. Error bars in panels (D, F, K and N) represent standard error of the mean. Panels (C, D, F, G and I) share the same
x‐axis legend (conditions). For pairwise comparisons, Student's
t‐test was performed for the estimation of the statistical significance. For the comparison of fluorescence signal intensities (panels C, G, I and M), KS‐test was used as a measure of statistical significance.
P‐value cut‐off used for computing statistical significance is < 0.05. * and ** in the figure refer to
P‐values ≤ 0.05 and ≤ 0.01, respectively. Statistically non‐significant comparisons are annotated as ns. Scale bars = 10 μm except for panel (L) = 20 μm.

