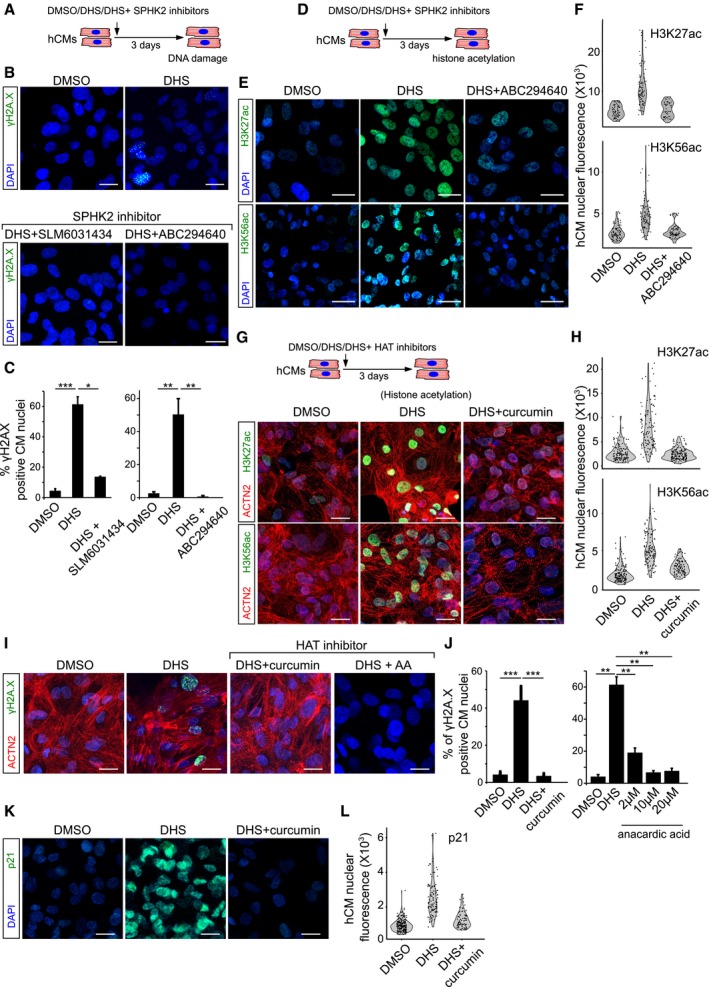
Schematic representation of the experimental set‐up.
SPHK2 inhibition using ABC294640 and SLM6031434 prevents DHS‐induced DNA damage as shown here by staining for γH2A.X (green) in hCMs.
Bar graphs representing the percentage of γH2A.X+ hCMs in the indicated conditions. Data represent measurements from ˜ 200 cells per condition, derived from three biological replicates.
Schematic representation of the experimental set‐up.
Treatment of hCMs with ABC294640, a specific SPHK2 inhibitor, prevents DHS‐induced epigenetic aberrations in hCMs visualized here by H3K56ac and H3K27ac staining (˜ 100 cells quantified/condition).
Violin plots depicting the distributions of the greyscale nuclear intensity of the indicated markers. Quantification represents measurements of ˜ 100–150 single nuclei per condition, derived from three biological replicates.
HAT inhibition by curcumin prevents the aberrant increase in H3K56ac and H3K27ac levels.
Violin plots depicting the distributions of the greyscale nuclear intensity of the indicated markers. Quantification represents measurements of ˜ 100–150 single nuclei per condition, derived from three biological replicates.
HAT inhibition prevents DHS‐induced DNA damage as shown here by staining for γH2A.X (green) on human cardiomyocytes.
Quantification of γH2A.X+ hCMs nuclei represented as percentage bar graph.
Curcumin‐mediated HAT inhibition abrogates the DHS‐induced upregulation of p21.
Violin plots depicting the distributions of the greyscale nuclear intensity of p21 stained nuclei. Quantification represents measurements of ˜ 100–150 single nuclei per condition, derived from three biological replicates.
Data information: ACTN2 is used to specifically label human cardiomyocytes. When not specified, the experiments were conducted in at least three biological replicates. Error bars in panels (C and J) represent standard error of the mean. For pairwise comparisons, Student's
t‐test was performed for the estimation of the statistical significance. For the comparison of fluorescence signal intensities (panels F, H and L), KS‐test was used as a measure of statistical significance.
P‐value cut‐off used for computing statistical significance is < 0.05. *, ** and *** in the figure refer to
P‐values ≤ 0.05, ≤ 0.01 and ≤ 0.001, respectively. Statistically non‐significant comparisons are annotated as ns. Scale bars for (B, E, G, I and K) = 10 μm.

