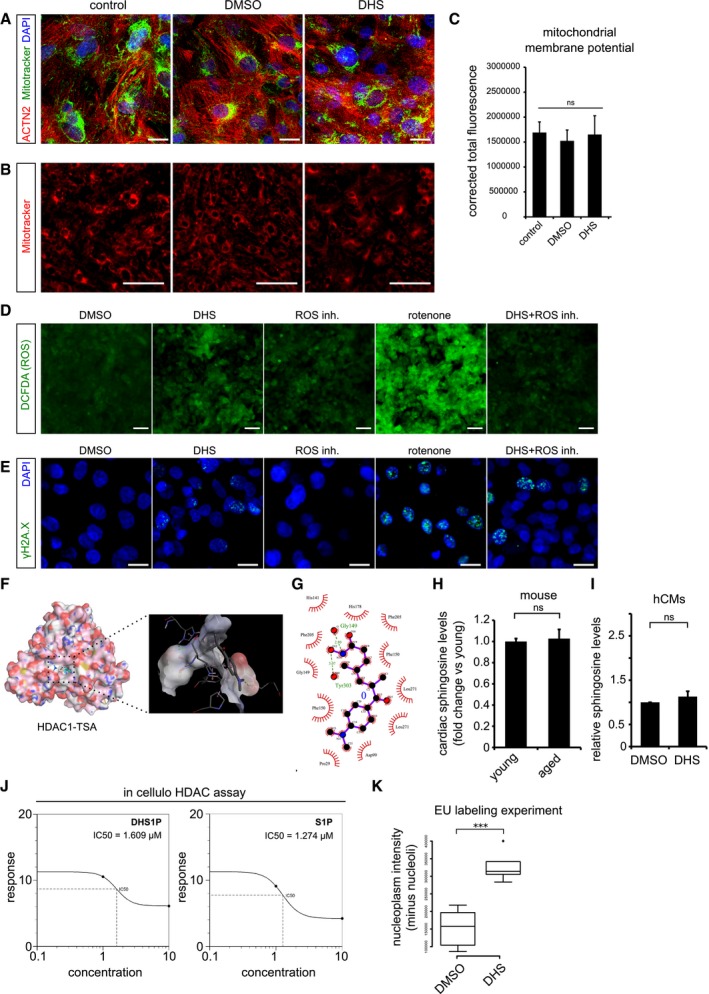
Elevated DHS levels in hCMs do not affect mitochondrial network and its membrane potential. Co‐staining of mitochondria by MitoTracker (in green) along with the cardiac‐specific marker ACTN2 (in red).
Micrographs of live cell imaging of hCMs stained with MitoTracker (in red).
Bar graph representing the corrected total fluorescence mean ± SEM, from live cardiomyocytes stained with MitoTracker n = 3, each condition.
Elevated DHS levels do not increase the ROS levels in human cardiomyocytes. Measurement of reactive oxygen species (ROS) in hCMs pre‐incubated for 72 h with DMSO, DHS, ROS inhibitors, rotenone and DHS + ROS inhibitors.
Elevated DHS levels induce ROS‐independent DNA damage as shown by immunostaining with γH2A.X (in green).
Molecular docking of human HDAC1 protein with Trichostatin TSA, a pan HDAC inhibitor, suggests potential binding within the known active site pocket (spotted square and the magnified view of the active site is to the right). TSA and HDAC1 are represented in ball & stick and spacefill models, respectively.
Ligplot representing the two‐dimensional interaction between the HDAC1 residues with TSA at the active site.
Cardiac sphingosine levels remain unchanged with age in vivo in mice. Bar graph depicting the relative sphingosine (Spo) levels in aged mouse hearts in comparison with the young ones.
Exogenous treatment of hCMs with 10 μM DHS did not alter sphingosine (Spo) levels, depicted as a bar graph in comparison with DMSO control. Experiment was performed in biological triplicate.
Concentration curves depicting the comparable IC50 values of DHS1P and S1P from in cellulo HDAC assay.
Box‐plot depicting the normalized nuclear (without nucleolus) intensities of nascent transcript, measured by EU labelling. Extremes of the error bars represent non‐outlier range, and their length represents the variability within the data. Horizontal line within the bars represents median of the underlying population. Box plot whiskers show 1.5 IQR of highest and lowest quartile, outliers are included (dots). Extremes of the error bars represent non‐outlier range and their length represents the variability within the data. Horizontal line within the bars represent median of the underlying population, respectively.
Data information: When not specified, the experiments were conducted in at least three biological replicates. Error bars in panels (C, H and I) represent standard error of the mean. For pairwise comparisons, Student's
t‐test was performed for the estimation of the statistical significance. For the comparison of fluorescence signal intensities (panels H and I), KS‐test was used as a measure of statistical significance.
P‐value cut‐off used for computing statistical significance is < 0.05. *** in the figure refers to
P‐values ≤ 0.001 and ≤ 0.0001, respectively. Statistically non‐significant comparisons are annotated as ns. Scale bar = 10 μm.

