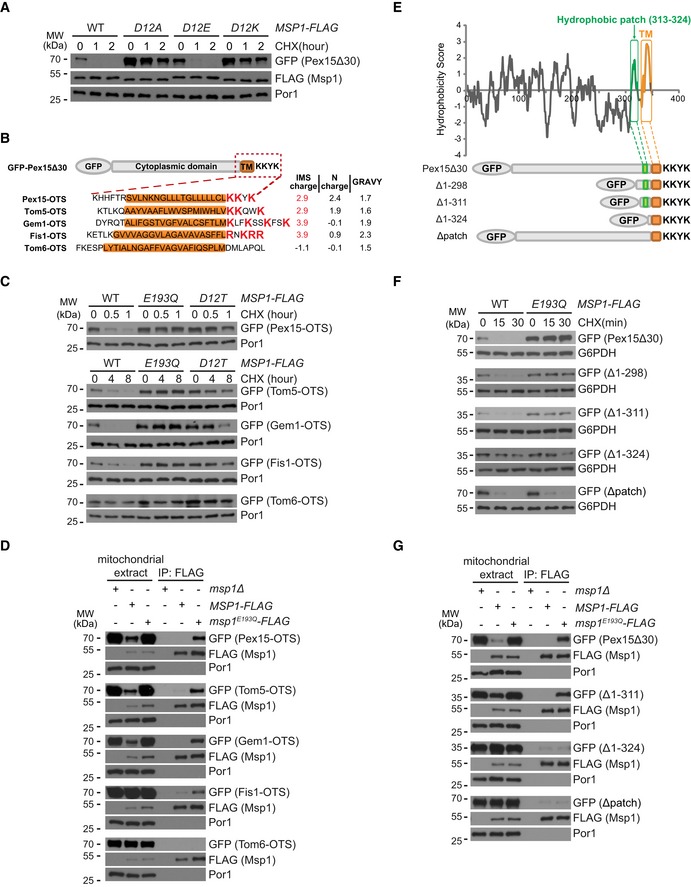
Degradation of GFP‐Pex15Δ30 by Msp1 D12 mutants.
Schematic illustration of the Outer mitochondrial membrane Targeting Sequences (OTSs) of GFP‐Pex15Δ30 and mitochondrial TA proteins. The GRAVY (Grand Average of Hydropathicity) values of TM domain (highlighted in orange) and the charges of the flanking sequences are shown on the right.
Degradation of GFP‐Pex15Δ30 and its chimeric variants by Msp1.
Interaction of GFP‐Pex15Δ30 and its chimeric variants with Msp1. Experiments were performed as in Fig
1D.
Hydrophobicity plot of Pex15Δ30 using the Kyte–Doolittle scale. The hydrophobic patch and the TM domain are highlighted in green and orange, respectively. Truncated forms of Pex15Δ30 are shown below.
Degradation of GFP‐Pex15Δ30 and its truncation mutants.
Interaction of GFP‐Pex15Δ30 and its truncation mutants with Msp1. Cells were analyzed as in (D).
Data information: In this figure, GFP‐Pex15Δ30 and its mutants were expressed from a centromeric plasmid under the control of
TEF1 promoter, and WT and mutant forms of Msp1‐FLAG were expressed from the endogenous chromosomal locus.

