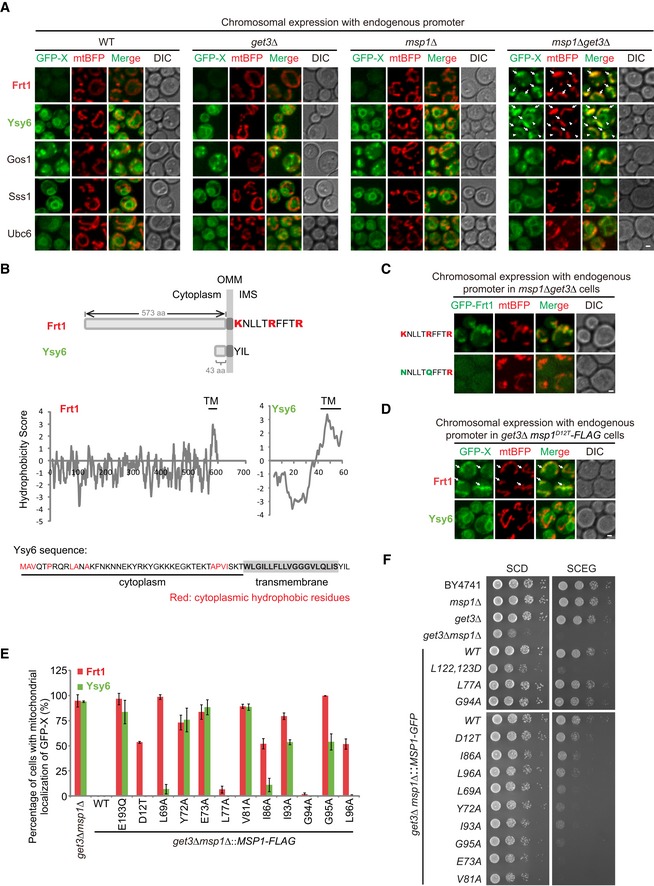
Localization of GFP‐tagged TA proteins in the indicated strains. Arrows point to the mitochondrial GFP‐Frt1 and GFP‐Ysy6 signals. Arrowheads point to GFP‐Ysy6 signals at the ER.
Schematic illustration of the IMS tail and sequence hydrophobicity of Frt1 and Ysy6. The amino acid sequence of Ysy6 is shown with the cytoplasmic hydrophobic residues highlighted in red.
Localization of GFP‐Frt1 with WT or mutant IMS tail in msp1Δ get3Δ cells.
Localization of GFP‐Frt1 and GFP‐Ysy6 in get3Δ msp1
D12T‐FLAG mutant cells. Arrows point to mitochondrial GFP‐Frt1.
The percentage of cells with mitochondrial GFP‐Frt1 or GFP‐Ysy6 in get3Δ cells expressing WT or mutant forms of Msp1‐FLAG. Data values represent means ± SEM from three independent experiments, with at least 50 cells counted in each experiment.
The indicated strains were grown in glucose media to log phase and then spotted on SCD or SCEG plates in a 10‐fold serial dilution, and then incubated at 30°C for 2–5 days.
Data information: In this figure, a gene cassette expressing GFP‐tagged TA protein under the control of endogenous promoter was integrated at the
his3 locus, and WT or mutant forms of Msp1‐FLAG were expressed from the endogenous chromosomal locus. Scale bars in (A, C, and D) represent 1 μm.

