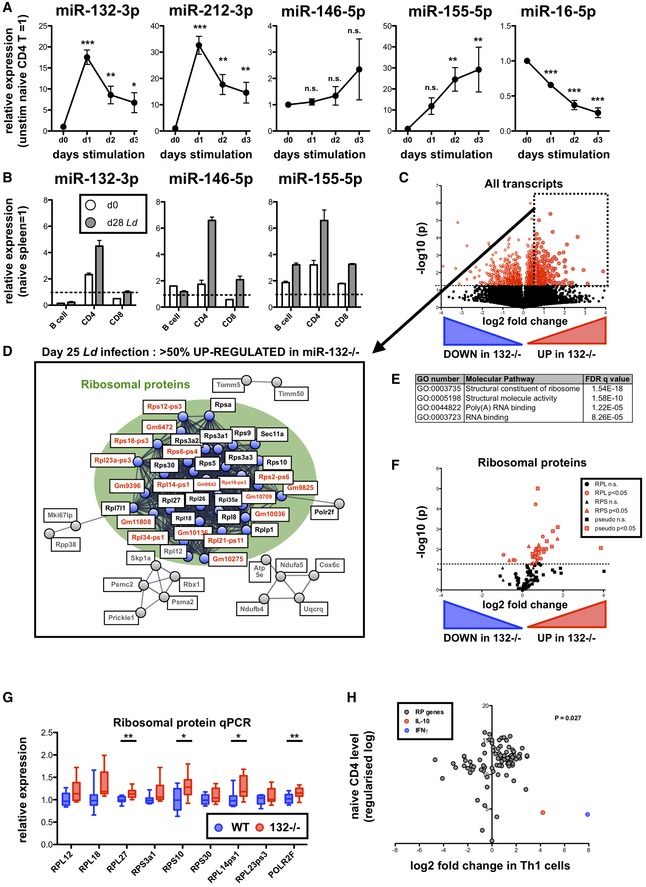
Expression of indicated miRNAs in sorted naïve (CD62L+ CD44−) CD4+ T cells and following in vitro stimulation with anti‐CD3/anti‐CD28 (1–3 days), relative to levels in cells prior to stimulation. Data from three independent experiments each using T cells pooled from 4 WT mice. Significance determined by one‐way ANOVA.
Expression of indicated miRNAs in purified spleen lymphocytes (B cells, CD4+ T cells and CD8+ T cells) from day (d) 0 naive (white) and d28 L. donovani‐infected (grey) mice. Expression of each miRNA normalised to levels in whole naïve spleen (dotted line). Data are mean + SEM of two experiments with cells purified from 3 to 5 pooled spleens.
Volcano plot of RNA‐seq gene expression in splenic WT and miR‐132
−/− CD4+ T cells from d28 L. donovani‐infected mice. Fold change determined as log2 mean FPKM (miR‐132
−/−/WT) from 4 WT and 5 miR‐132
−/− mice. Transcripts significantly different between WT and miR‐132−/− (P < 0.05) are shown in red. Dotted box indicates transcripts significantly up‐regulated in miR‐132−/− CD4+ T cells by more than 50%.
STRING network analysis of significantly up‐regulated transcripts in CD4+ T cells from spleen of d28 L. donovani‐infected miR‐132
−/− mice compared to WT cells. Cluster of ribosomal proteins shown in green circle, with coding RP transcripts (black) and pseudogenes (red) indicated. Secondary clusters are shown in grey.
Top enriched molecular function Gene Ontology terms for genes significantly up‐regulated in CD4+ T cells from spleens of infected miR‐132
−/− mice compared to WT mice.
Volcano plot of all RP genes in splenic WT and miR‐132
−/− CD4+ T cells from d28 L. donovani‐infected mice. RPL genes are shown as circles, RPS genes as triangles and pseudogenes as squares. Red symbols indicate significant difference between WT and miR‐132−/− cells (P < 0.05) whereas black symbols non‐significant.
Expression of RP transcripts determined by qPCR from L. donovani‐infected d28 WT (blue) and miR‐132
−/− mice (red). N = 9 for each WT and miR‐132
−/− from two independent infection experiments. Box extends from 25th to 75th percentile, whiskers are minimum and maximum values, and horizontal lines indicate median. Significance determined by unpaired t‐test.
Fold change of all RP transcripts (grey) in Th1 cells compared to naïve CD4
+ T cells. Data taken from RNA sequencing experiments described in reference
24. Fold changes in IL‐10 (red) and IFNγ (blue) indicated for comparison. The statistical significance of the observed up‐regulation of RP transcripts in Th1 cells is determined by chi‐squared test.
< 0.001.