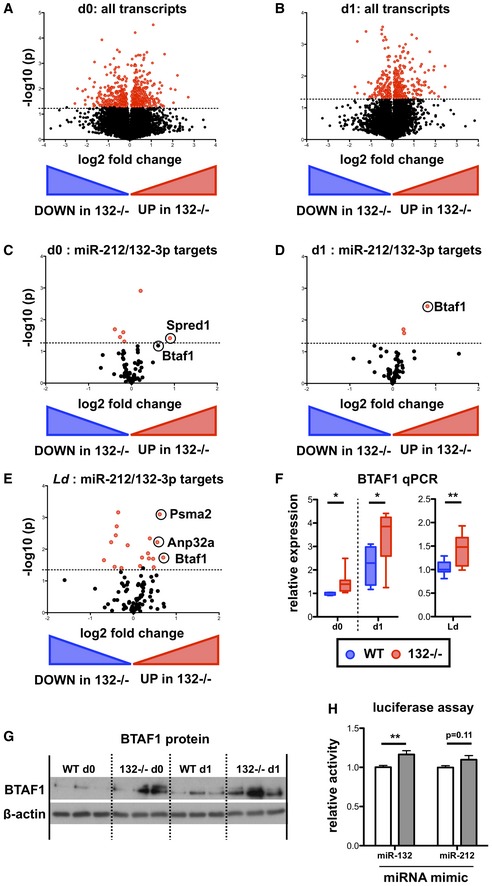
Volcano plot (Log2(Fold Change) vs. −Log(P‐value)) of RNA gene expression in purified naïve CD62L+ CD44− WT and miR‐132
−/− CD4+ T cells. Fold change determined as log2 mean FPKM (miR‐132
−/−/WT) from 4 WT and 4 miR‐132
−/− mice. Transcripts significantly different between WT and miR‐132
−/− cells (P < 0.05) are shown in red.
Volcano plot of RNA gene expression in purified naïve CD62L+ CD44− WT and miR‐132
−/− CD4+ T cells following 18 h in vitro stimulation with anti‐CD3/anti‐CD28 under Th1 conditions. Fold change determined as log2 mean FPKM (miR‐132
−/−/WT) from 4 WT and 4 miR‐132
−/− mice. Transcripts significantly different between WT and miR‐132
−/− cells (P < 0.05) are shown in red.
Volcano plot of transcripts containing a conserved miR‐212/132‐3p target site in naïve CD4+ T cells from WT or miR‐132
−/− mice.
Volcano plot of transcripts containing a conserved miR‐212/132‐3p target site in in vitro polarised (Th1 conditions, 18 h post‐stimulation) CD4+ T cells from WT or miR‐132
−/− mice.
Volcano plot of transcripts containing a conserved miR‐212/132‐3p target site in spleen CD4+ T cells from day (d) 28 L. donovani‐infected WT or miR‐132
−/− mice.
BTAF1 transcript levels determined by qRT‐PCR in WT (blue) or miR‐132
−/− (red) in naïve (d0) and Th1 polarised for 18 h (d1) CD4+ T cells, and CD4+ T cells from d28 L. donovani‐infected WT or miR‐132
−/− mice. N = 8–9 for each WT and miR‐132
−/−.
Expression of BTAF1 protein in d0 naïve and d1 (18 h) Th1‐polarised WT and miR‐132
−/− CD4+ T cells, as determined by Western blot. Each lane from individual mouse, and representative of two independent experiments.
Relative luciferase activity in HeLa transfected with plasmid containing WT BTAF1 3′UTR (white) or BTAF1 3′UTR on which the miR‐132 binding site is mutated (grey) downstream of Renilla luciferase, in the presence of miR‐132‐3p or miR‐212‐3p mimics. Error bars indicate SEM from eight replicate treatments.
‐test. *
< 0.01.