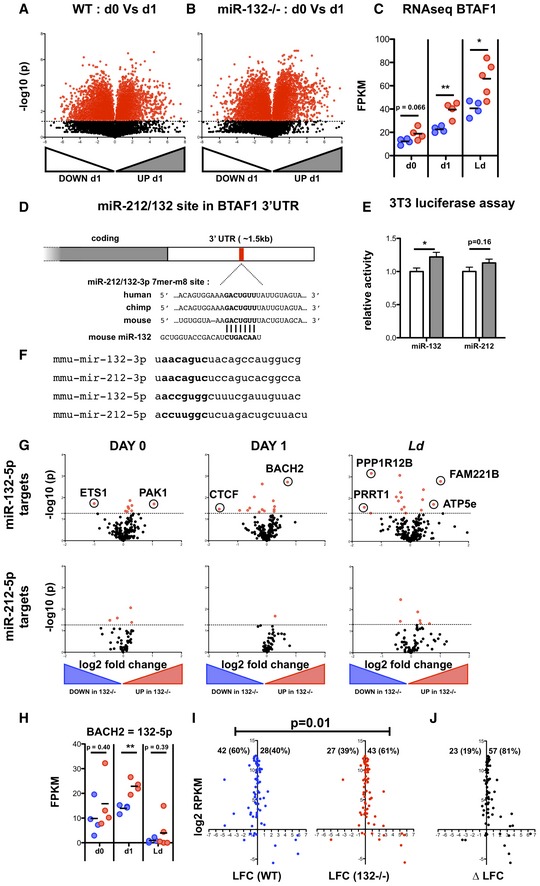
Volcano plot of RNA‐seq gene expression in purified CD62L+ CD44− naïve WT cells before and after 1 day (18 h) stimulation with anti‐CD3/anti‐CD28. Fold change determined as log2 mean FPKM (stimulated/pre‐stimulation) from 4 WT mice. Transcripts significantly different (P < 0.05) are shown in red.
Volcano plot of RNA‐seq gene expression in purified CD62L+ CD44− naïve miR‐132
−/− cells before and after 1 day (18 h) stimulation with anti‐CD3/anti‐CD28. Fold change determined as log2 mean FPKM (stimulated/pre‐stimulation) from 4 WT mice. Transcripts significantly different (P < 0.05) are shown in red.
RNA‐seq gene expression levels of BTAF1 from pre‐stimulation (d0), 18 h anti‐CD3/anti‐CD28 (d1) and the spleen of d28 L. donovani infection (Ld), from WT (blue) and miR‐132
−/− (red) mice (n = 4–5 mice per group). Significance determined by unpaired t‐test as indicated.
Schematic of miR‐212/132‐3p 7mer‐m8 site in the 3′UTR of BTAF1 transcript, showing conservation in human, mouse and chimp. The site is also conserved in, rhesus, squirrel, rabbit, pig, cow, cat, dog, brown bat, elephant, opossum, macaw and chicken, but not rat or lizard.
Relative luciferase activity in mouse 3T3 cells transfected with plasmid containing WT (white) or miR‐212/132‐mutant (grey) BTAF1 3′UTR immediately downstream of Renilla luciferase, in the presence of miR‐132‐3p or miR‐212‐3p mimics. Error bars indicate SEM from eight replicate treatments. Significance determined by unpaired t‐test.
Nucleotide sequences of mouse mature miRNA derived from miR‐212/132 cluster. Seed sequences indicated in bold.
Volcano plots of RNA‐seq gene expression for transcripts containing a poorly conserved miR‐132‐5p site (upper panels) or a broadly evolutionary conserved miR‐212‐5p site (lower panels). Fold change determined as log2 mean FPKM miR‐132
−/−/WT) from 4 WT and miR‐132
−/− mice. Transcripts significantly different between WT and miR‐132−/− (P < 0.05) are shown in red. Data compare pre‐stimulation naïve CD4 T cells (d0, left panels); after 18 h in vitro stimulation with anti‐CD3/anti‐CD28 (d1, middle panels); and from the spleens of d28 L. donovani‐infected mice. Transcripts that are significantly different (P < 0.05) and show > 2 fold change in expression are indicated.
RNA levels of BACH2 (based on RNA‐seq) from pre‐stimulation (d0), 18 h anti‐CD3/anti‐CD28 (d1) and the spleen of d28 L. donovani infection (Ld), from WT (blue) and miR‐132
−/− (red) mice. Significance determined by unpaired t‐test as indicated (n = 4–5 mice per group).
Log2 fold change (LFC) in RP genes after 18 h in vitro stimulation of WT (blue) or miR‐132−/− naïve CD4+ T cells with anti‐CD3/anti‐CD28. Percentages of up‐regulated and down‐regulated transcripts in WT (40%) and miR‐132
−/− (61%) cells are shown. Statistical significance is determined with chi‐squared test.
DeltaLFC (LFCmiR‐132−/− − LFCWT) after 18 h in vitro stimulation of WT (blue) or miR‐132
−/− naïve CD4+ T cells with anti‐CD3/anti‐CD28. Significance is determined with chi‐squared test. Data information: *P < 0.05, **P < 0.01.