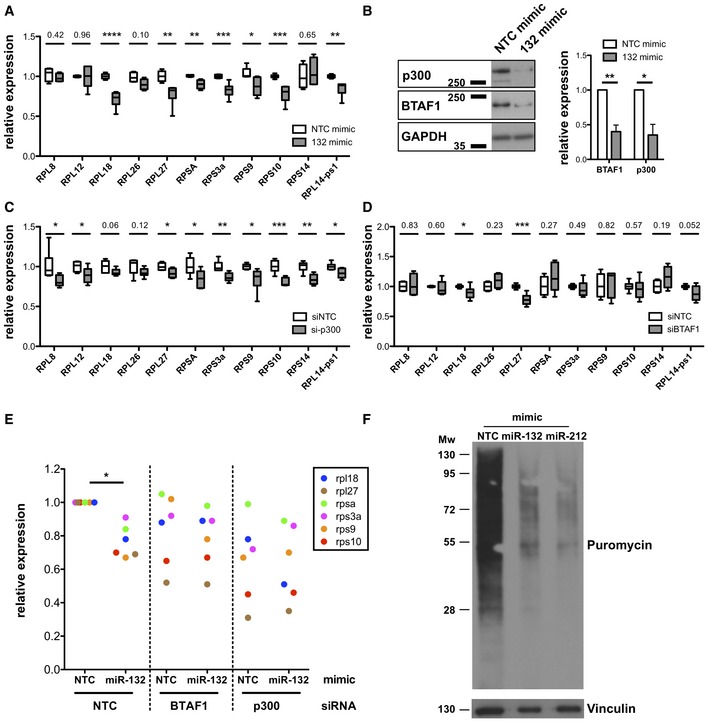
mRNA levels of indicated RP transcripts determined by qRT–PCR in MEFs transfected with Non‐targeting control (NTC) mimics (white) or miR‐132‐3p mimics (grey).
p300 and BTAF1 protein levels in MEF transfected with NTC mimics or miR‐132‐3p mimics determined by Western blot. GAPDH was used as a loading control. Right panel indicates mean + SEM of four experiments.
mRNA levels of indicated RP transcripts determined by qRT–PCR in MEFs transfected with NTC siRNA (white) or p300 siRNA (grey).
mRNA levels of indicated RP transcripts determined by qRT–PCR in MEFs transfected with NTC siRNA (white) or BTAF1 siRNA (grey).
mRNA levels of indicated RP transcripts determined by qRT–PCR in MEFs transfected with NTC or miR‐132‐3p mimics and NTC siRNA or p300 or BTAF1 siRNAs for 48 h. Levels are normalised to cells transfected with NTC siRNA and NTC mimic.
Puromycin incorporation (following 10‐min pulse and 50‐min chase) determined by Western blot in MEFs transfected with NTC or miR‐132‐3p or miR‐212‐3p mimics.
Data information: Statistical significance is determined by unpaired
t‐test from 4 to 6 experiments. *
P < 0.05, **
P < 0.01, ***
P < 0.001, ****
P < 0.0001.
Source data are available online for this figure.