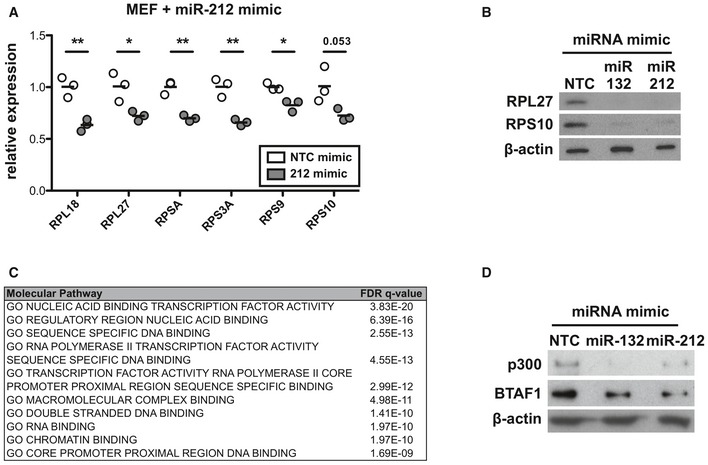
Figure EV3. miR‐132 and its targets p300 and BTAF1 control RP expression.

- mRNA levels of indicated RP transcripts determined by qRT–PCR in MEFs transfected with NTC mimics (white) or miR‐212‐3p mimics (grey). Cultures performed in triplicate. Statistical significance determined by t‐test.
- Protein levels determined by Western blot of RPL27 and RPS10 in MEFs transfected with NTC, miR‐132‐3p or miR‐212‐3p mimics for 48 h.
- Top enriched molecular function GO terms for miR‐132/212‐3p predicted target genes. Predictions retrieved from Targetscan, total context score < −0.1.
- Protein levels determined by Western blot of BTAF1 and p300 in EL4 cells transfected with NTC, miR‐132‐3p, or miR‐212‐3p mimics for 48 h.
