Statistical analysis of associations between exposure to
F. nucleatum and up‐regulation of
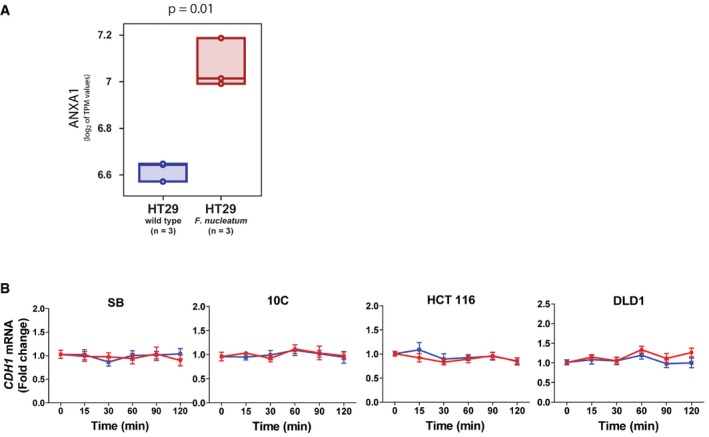
ANXA1 mRNA expression levels in colon cancer cell HT29. The
ANXA1 mRNA levels in HT29 cells were analyzed in an RNA‐sequencing (RNA‐seq) dataset publicly available from the NCBI‐GEO online repository (
GSE90944) and containing global gene‐expression measurements from HT29 cells, both at baseline and following incubation with
F. nucleatum ATCC25586 in triplicates
14. The distribution of
ANXA1 mRNA expression levels in the two sample groups (baseline versus infected) was visualized using boxplots, using the log
2 of their TPM (
transcripts per million) expression values as a metric. Individual data points were represented as circles, and box‐plots were drawn to span the inter‐quartile range (from the 25
th to the 75
th percentile) with an internal band to identify the median. Differences in mean log
2 TPM values between HT29 cells at baseline (
n = 3) and following incubation with
F. nucleatum (
n = 3) were tested for statistical significance using a two‐tailed
t‐test for continuous variables. The analysis revealed that HT29 cells exposed to
F. nucleatum were characterized by increased levels of
ANXA1 mRNA expression, as compared to HT29 cells at baseline (
P = 0.01).