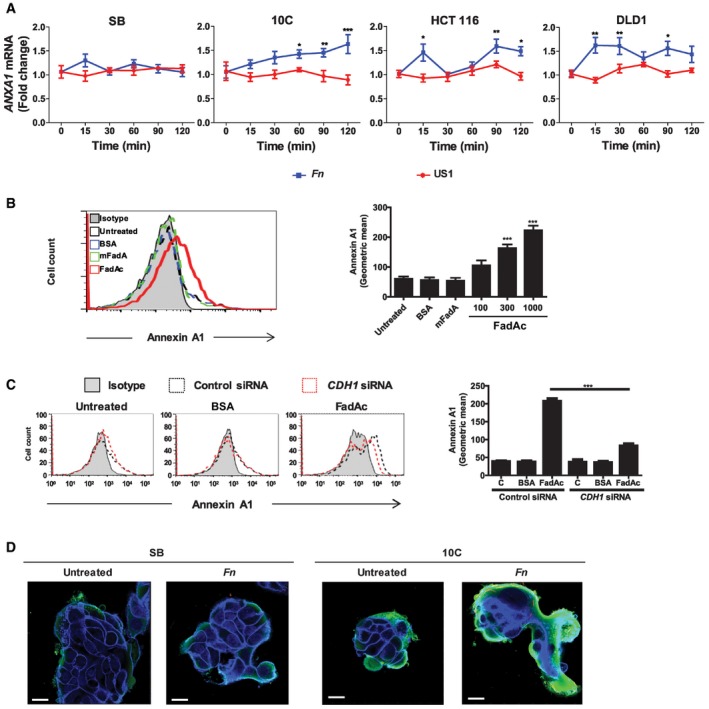
Real‐time qPCR analysis of ANXA1 mRNA levels in SB, 10C, HCT116, and DLD1 cells incubated with wild‐type F. nucleatum 12230 (Fn) or fadA‐deletion mutant US1 (US1) at MOI of 50:1 for the indicated time periods. The results were normalized to those obtained with untreated cells and were the mean of three independent experiments each performed in triplicates. Data are mean values ± SEM. *P < 0.05, **P < 0.01, and ***P < 0.001 (two‐way ANOVA).
Flow cytometry analysis of Annexin A1 expression in 10C cells either untreated, or incubated with BSA (1,000 μg/ml), or mFadA (1,000 μg/ml), or FadAc (100, 300, or 1,000 μg/ml) for 1 h. Data are mean values ± SD. The experiment was performed in triplicates and repeated more than three times. ***P < 0.001 (one‐way ANOVA).
Flow cytometry analysis of Annexin A1 in 10C cells transfected with control siRNA (dotted black line) or CDH1‐specific siRNA (dotted red line) followed by no treatment (untreated), or incubation with BSA (1,000 μg/ml) or FadAc (1,000 μg/ml) for 1 h. Data are mean values ± SD. The experiment was performed in triplicates and repeated twice. ***P < 0.001 (two‐way ANOVA).
Confocal microscopy analysis of SB and 10C cells either untreated or following incubation with CFSE‐labeled F. nucleatum 12230 (Fn) for 1 h at MOI of 5:1. Annexin A1 was stained green and E‐cadherin blue. Imagines are 800× magnification. Note the enhanced expression of Annexin A1 in 10C compared to SB and its location on the outer layer of the cell mass. The experiment was repeated three times. Scale bar, 250 nm.