
Figure EV4. Co‐localization of F. nucleatum 12230, Annexin A1 and E‐cadherin on DLD1 cells.
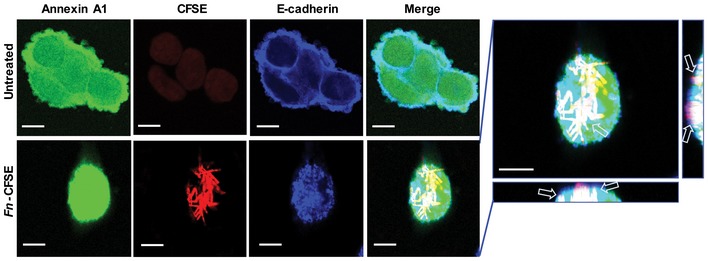
Confocal microscopy analysis of DLD1 cells either untreated (top panel) or following incubation with CFSE‐labeled F. nucleatum 12230 (red, bottom panel) at MOI of ~5:1 for 3 h and immunostaining of Annexin A1 (green) and E‐cadherin (blue). Images were 1,200× magnification. Arrows point to co‐localization of Annexin A1, E‐cadherin, and F. nucleatum. The side views are shown to the right and bottom of the enlarged image. Scale bar, 500 nm.