
Figure 5. FadA, E‐cadherin, Annexin A1, and β‐catenin form a complex in cancerous cells.
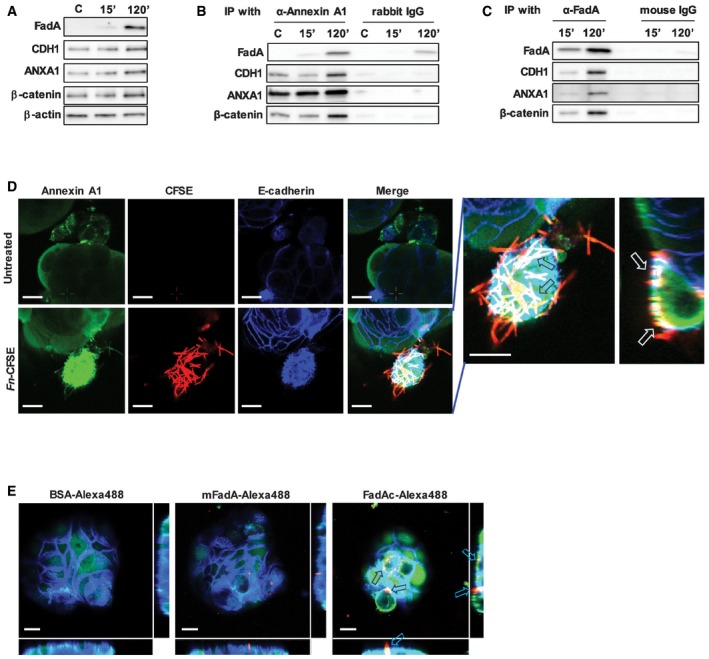
- Western blot analysis of FadA, E‐cadherin (CDH1), Annexin A1 (ANXA1), and β‐catenin in DLD1 cells following incubation with FadAc for 15 or 120 min. C, untreated cells. β‐Actin was included as an internal control. The experiment was repeated three times.
- Co‐immunoprecipitation with Annexin A1. DLD1 cell lysates were incubated with FadAc for 15 or 120 min and then mixed with agarose beads conjugated with rabbit anti‐Annexin A1 polyclonal antibody (α‐Annexin A1) or control rabbit IgG. FadA, E‐cadherin (CDH1), Annexin A1 (ANXA1), and β‐catenin in the eluates were detected by Western blot. C, untreated control. The experiment was repeated three times.
- Co‐immunoprecipitation with FadA. DLD1 cell lysates were incubated with FadAc for 15 or 120 min and then mixed with agarose beads conjugated with mouse anti‐FadA monoclonal antibody (α‐FadA) or control mouse IgG. FadA, E‐cadherin (CDH1), Annexin A1 (ANXA1), and β‐catenin in the eluates were detected by Western blot. The experiment was repeated three times.
- Confocal microscopy analysis of 10C cells either untreated (top panel) or following incubation with CFSE‐labeled F. nucleatum 12230 (red, bottom panel) for 3 h and then immunofluorescent‐stained for Annexin A1 (green) and E‐cadherin (blue). Images are 1,200× magnification. A side view of the enlarged image is shown on the far right. Note the enhanced expression of Annexin A1 in the F. nucleatum‐bound cells and the co‐localization of Annexin A1, E‐cadherin, and F. nucleatum on the cell membranes (arrows). The experiment was repeated more than three times. Scale bar, 500 nm.
- Confocal microscopy analysis of 10C cells following incubation with Alexa Fluor™ 488‐conjugated BSA, mFadA, or FadAc (red) for 1 h followed by immunostaining of Annexin A1 (green) and E‐cadherin (blue). Images are 1,200× magnification. Note the enhanced expression of Annexin A1 and its co‐localization with E‐cadherin in the presence of FadAc (arrows), but not with BSA or mFadA. The experiment was repeated twice. The side views are shown to the right and bottom of each image. Scale bar, 500 nm.
Source data are available online for this figure.