
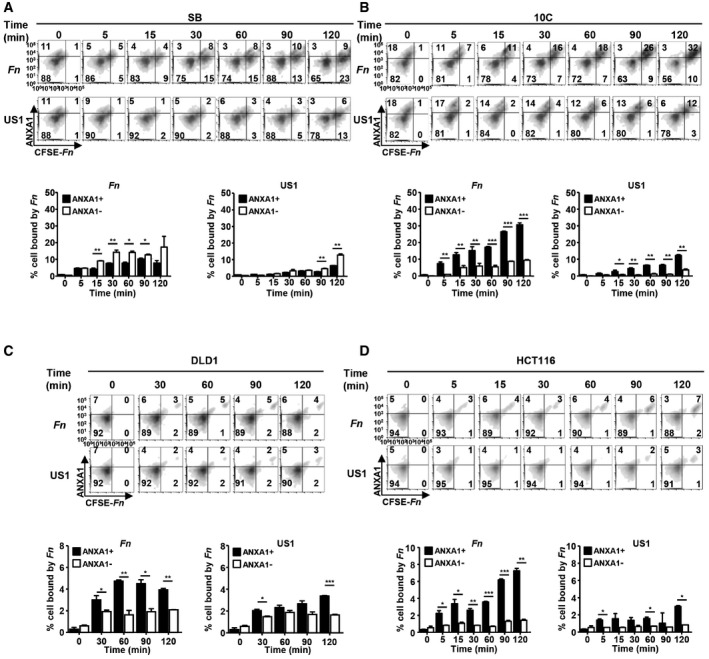
Figure 6. Positive feedback loop between FadA and Annexin A1.
-
A–DFlow cytometry analysis of SB (A), 10C (B), DLD1 (C), and HCT116 (D) cells incubated with CFSE‐labeled F. nucleatum 12230 (Fn) or its fadA‐deletion mutant US1 (US1) at MOI of 10–20:1 for the indicated time and immunostained with anti‐Annexin A1 antibodies. Shown on the top panels are the density plots. x‐axis, CFSE‐labeled F. nucleatum or US1 (CFSE‐Fn); y‐axis, Annexin A1 (ANXA1). Shown on the bottom panels are the percentages of Annexin A1‐positive (solid bars) or negative (clear bars) cells bound by F. nucleatum or US1 out of the total number of cells analyzed. Data are mean values ± SD. The experiments were performed in triplicates and repeated 2–3 times. *P < 0.05, **P < 0.01, ***P < 0.001 (two‐way ANOVA).