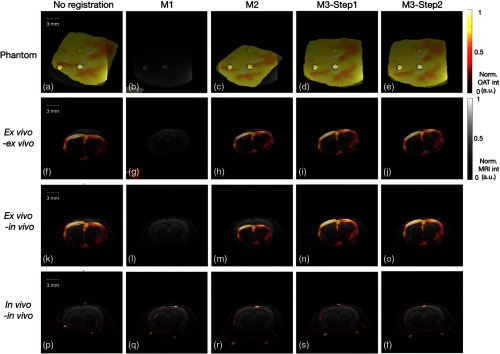
Fig. 5.
Comparison of different registration methods in different registration tasks. Rows (1) to (4) show the overlaid OAT (“HOT” scale) and MRI (gray) images of four tasks: (1) phantom, (2) ex vivo OAT–ex vivo MRI mouse brain, (3) ex vivo OAT–in vivo MR images of mouse brain, and (4) in vivo OAT–in vivo MRI mouse brain. The columns (left to right) display before registration and resulting images using M1, M2, and M3 registration, respectively. M1 and M2 resulted in misalignment due to the interference from the background noise and overdependence on the texture of inner structure obtained from different modalities, having different interpretation of intensity values.

