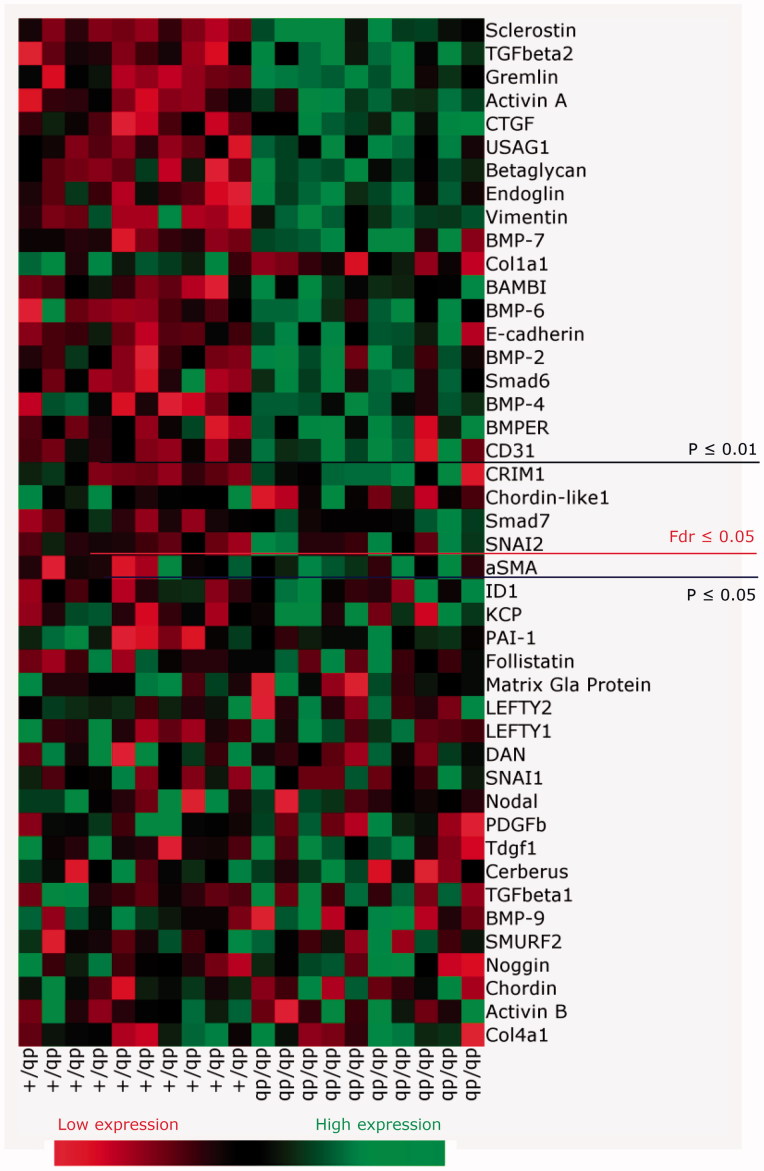
Figure 5.
Heat map of expression of genes in the TGF-β family regulated in db/db animals vs. db/+ controls at 15 weeks of age. Values correspond to deltaCT values and in the online version of the manuscript the color coding corresponds to the relative expression in db/+ and db/db. High gene expression (a low deltaCT) is shown in green whereas low gene expression (a high deltaCT) is shown in red. Genes are ordered based on p values. The false discovery rate (Fdr) was set at .05 corresponding to a p values of .024.

