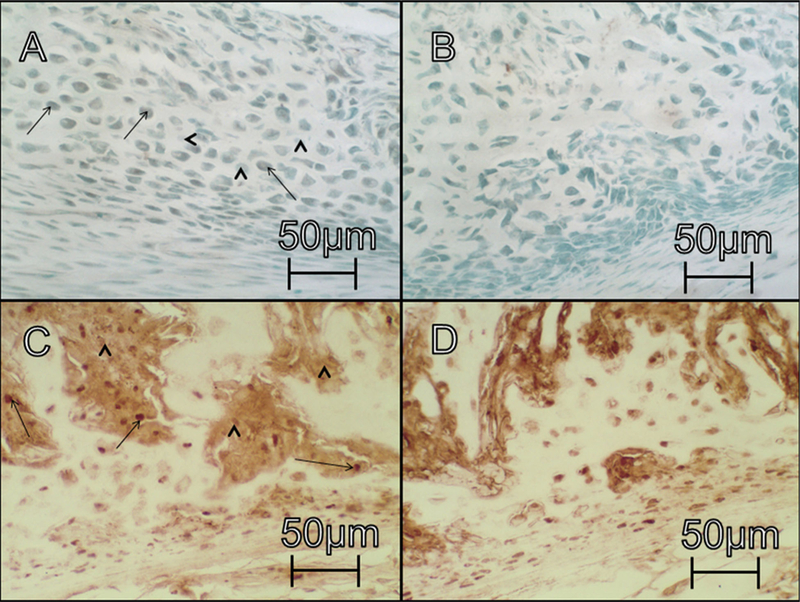
Figure 3.

Immunohistochemical comparison between UL treated and saline control rats: panels A and B show (VEGF-C stain at 50×) show cross-sections of UL and saline control groups, respectively, at day 7 post-fracture. Panels C and D (PCNA stain at 50×) show cross-sections of UL and saline control groups, respectively, at day 7 post-fracture. Scale bar is equivalent to 50 mm as visualized under the light microscope. Strait arrows and arrowheads indicate representative cells that were positive and negative, respectively, for each stain.
