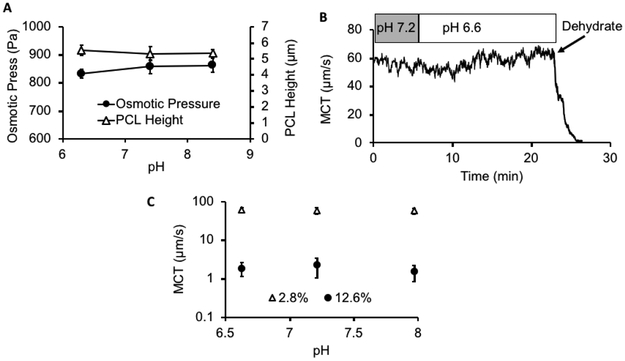
Figure 4:
Effect of pH on MCT, osmotic pressure, and PCL height A: Effect of pH on mucus osmotic pressure (●) and PCL height (△) of 6.5% solids mucus on HBE culture. Note, the PCL height is normally ~ 7μm with a normal 2% solids (100 Pa) mucus layer apposed to it. B: Example trace of the effects of acidification (5% CO2, pH 7.2, to 15% CO2, pH 6.6) compared to changes in mucus concentration (by dehumidification) on MCT rate during a single experiment. C: Summary of the MCT rates comparing changes in concentration, 2.8% solids (△) vs. 12.6% solids (●) vs. pH (6.6, 7.2, and 7.9).

