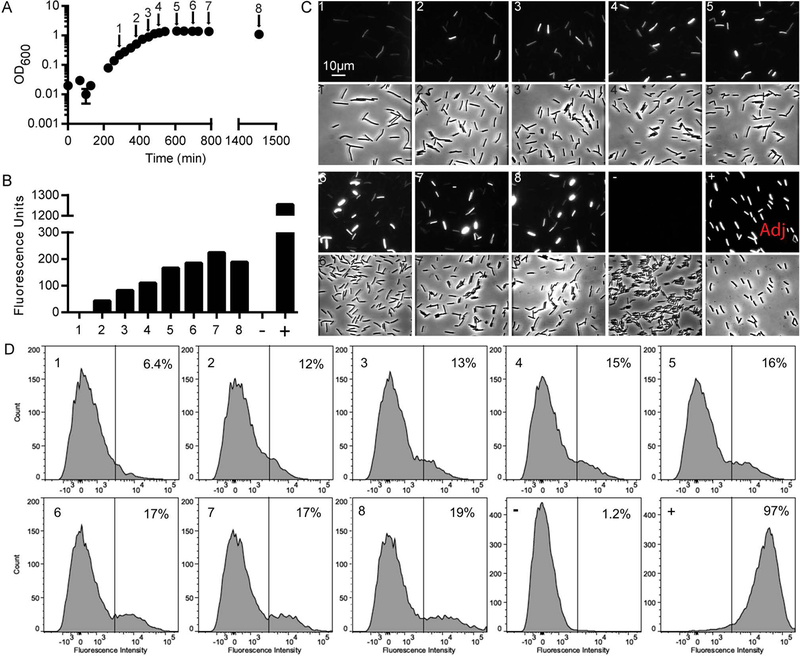
Figure 2. Bistable expression of PtcdA::rfp in C. difficile R20291.

(A) Growth curve of PtcdA::rfp strain. At the times indicated by the arrows, samples of the culture were fixed with paraformaldehyde and exposed to air to allow red fluorescence to develop. (B) Specific fluorescence of PtcdA::rfp population as determined using a plate reader. Numbers on the x-axis refer to samples fixed at the time points indicated in (A). Also shown is a negative control strain containing a Ptet::gus reporter plasmid (−) and a positive control strain carrying a PpdaV::rfp reporter plasmid and induced with lysozyme for 30 min (+). (C) Expression of PtcdA::rfp as assessed by microscopy. Micrographs are paired: fluorescence (above) and phase micrographs (below). All micrographs were captured and processed identically except for one marked “Adj” which indicates the brightness was adjusted down. (D) Expression of PtcdA::rfp as assessed by flow cytometry. The x-axis label is Fluorescence Intensity in arbitrary units. Vertical gate divides TcdA-ON from TcdA-OFF subpopulations, and numbers in the upper right corner of each panel refers to the fraction of cells scored as TcdA-ON.
