-
A
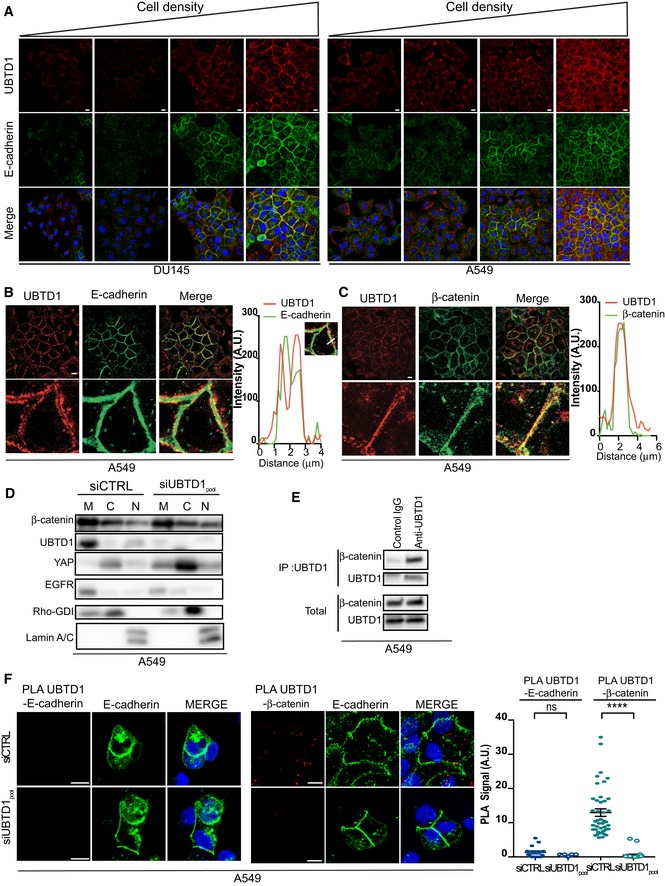
Representative confocal images of DU145 or A549 cells at various cell densities ranging from 20 to 100% confluence used for Figs
2A and
3A.
-
B, C
Left, immunofluorescent labeling of UBTD1 and E‐cadherin (B) or β‐catenin (C) at cell–cell contacts in A549 cells and analyzed by confocal microscopy. Right, representative histogram of co‐localization profile prepared with RGB profiler plugin of ImageJ.
-
D
Immunoblots of UBTD1, β‐catenin, and YAP after subcellular fractionation of confluent A549 cells transfected with the indicated siRNA (control, siCTRL; UBTD1, siUBTD1pool). EGFR, RhoGDI, and Lamin A/C were used as controls for the membrane (M), cytosol (C), and nucleus (N) compartments, respectively.
-
E
Co‐immunoprecipitation between endogenous β‐catenin and UBTD1 was performed in confluent A549 cells. IgG isotype was used as a negative control. (D) Proximal ligation assay monitoring (left) and quantification (right) of UBTD1 interaction with E‐cadherin or β‐catenin in A549 cells.
-
F
Proximal ligation assay monitoring (left) and quantification (right) of UBTD1 association with E‐cadherin or β‐catenin in A549 cells transfected with the indicated siRNA (control, siCTRL; UBTD1, siUBTD1pool).
Data information: For microscopy imaging panels (A, F), nuclei were stained with DAPI (blue) on the MERGE image. Scale bars = 10 μm;
n ≥ 3 independent experiments; ****
P < 0.001; (F) two‐tailed
t‐test; data are mean ± s.e.m.
Source data are available online for this figure.