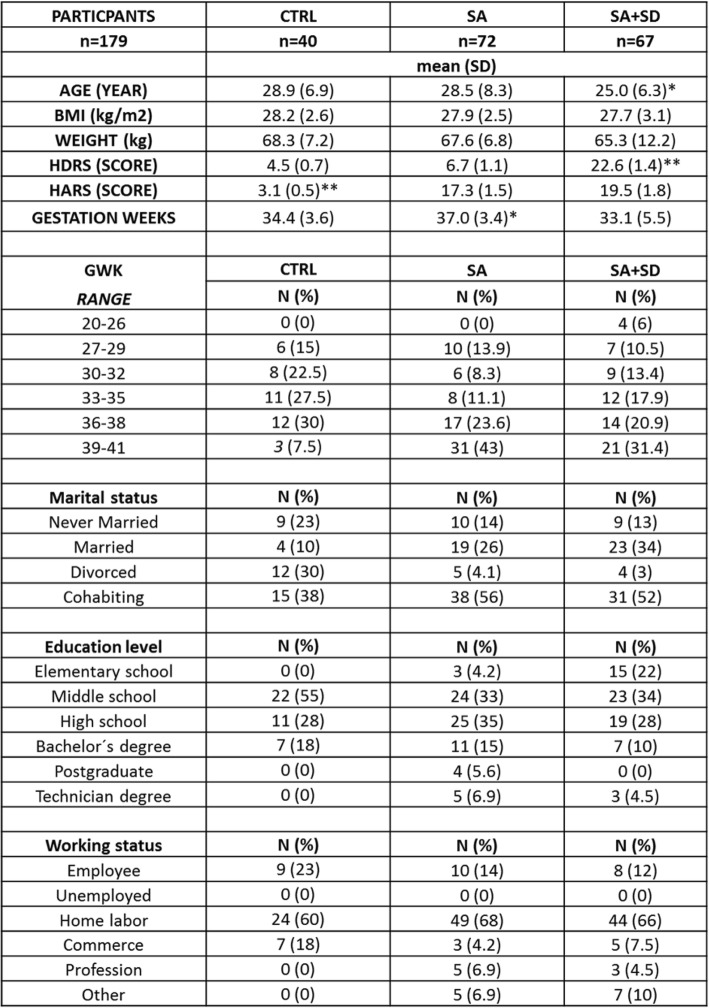
Table 1.
The non-parametric, t-test with Welch’s correction was used to detect statistical differences between demographic measures among the studied groups
(*) p < 0.005, indicates the differences in age and gwks found among tested groups. (**) p < 0.001, indicates the differences found between the final HDRS score values estimated for either the SA + SD and the CTRL groups, respectively; or between the final HARS score values estimated for each of the studied groups. Data are expressed as the mean ± SD. Data were calculated using GraphPad-v.7
Abbreviations: SA + SD severe anxiety plus comorbid severe depression; SA severe anxiety, CTRL control, HDRS Hamilton Depression Rating Scale, HARS Hamilton Anxiety Rating Scale, BMI Body Mass Index, GWK gestational weeks

