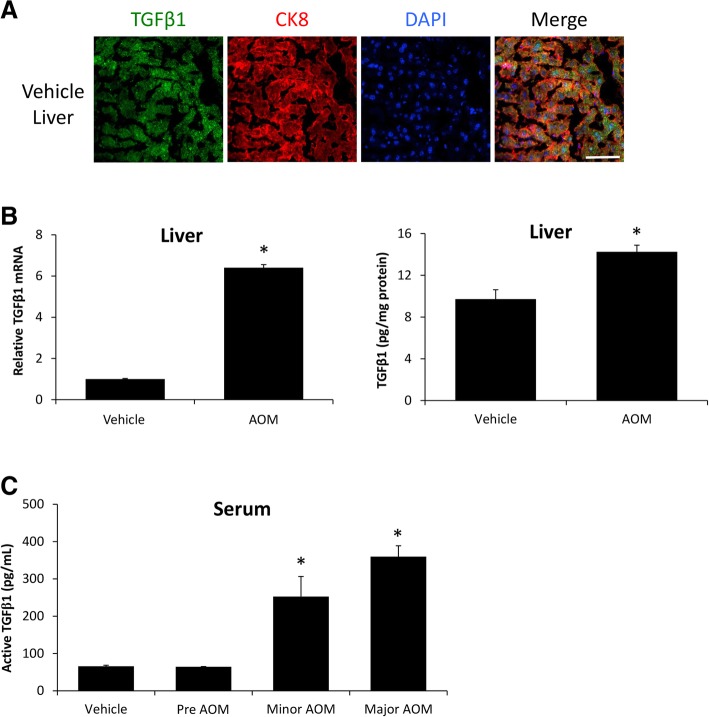
Fig. 1.
Hepatic TGFβ1 is increased during AOM-induced HE. a Immunofluorescence for TGFβ1 (green) and CK8 (red) in mice injected with saline. Scale bar indicates 50 μM. b Relative TGFβ1 mRNA expression in the livers from vehicle- and AOM-treated mice. c Concentration of active TGFβ1 levels in liver homogenates normalized by total protein concentration in vehicle and AOM-treated mice. d Serum active TGFβ1 concentration measured in picograms per milliliter of serum from vehicle and AOM-treated time course mice. *p < 0.05 compared to vehicle-treated mice. n = 3 for TGFβ1 mRNA analyses and n = 4 for ELISA analyses

