
Fig. 4.
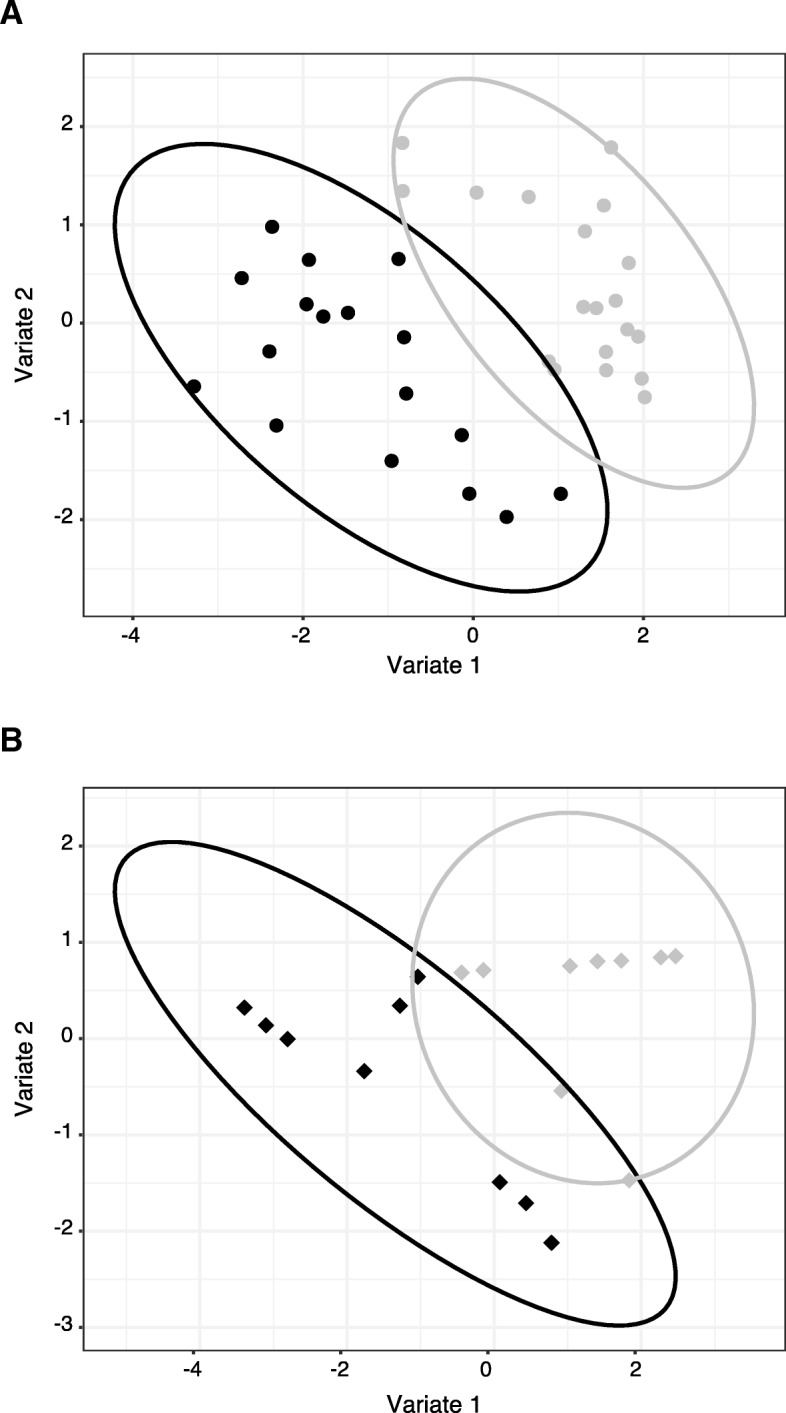
Scores plot analysis of metabolite profiles in urine of B6 and pIgR−/− mice. GC-MS was performed on urine samples to determine the profile of metabolites excreted in the urine of a male and b female B6 and pIgR−/− mice. To control for sample variation due to urine volume and concentration, the annotated urine metabolites were normalized by Mean Absolute Deviation (MAD). Data was analyzed by sPLS-DA and scores plot, with 95% confidence intervals of the sample space highlighted by elliptical boundaries