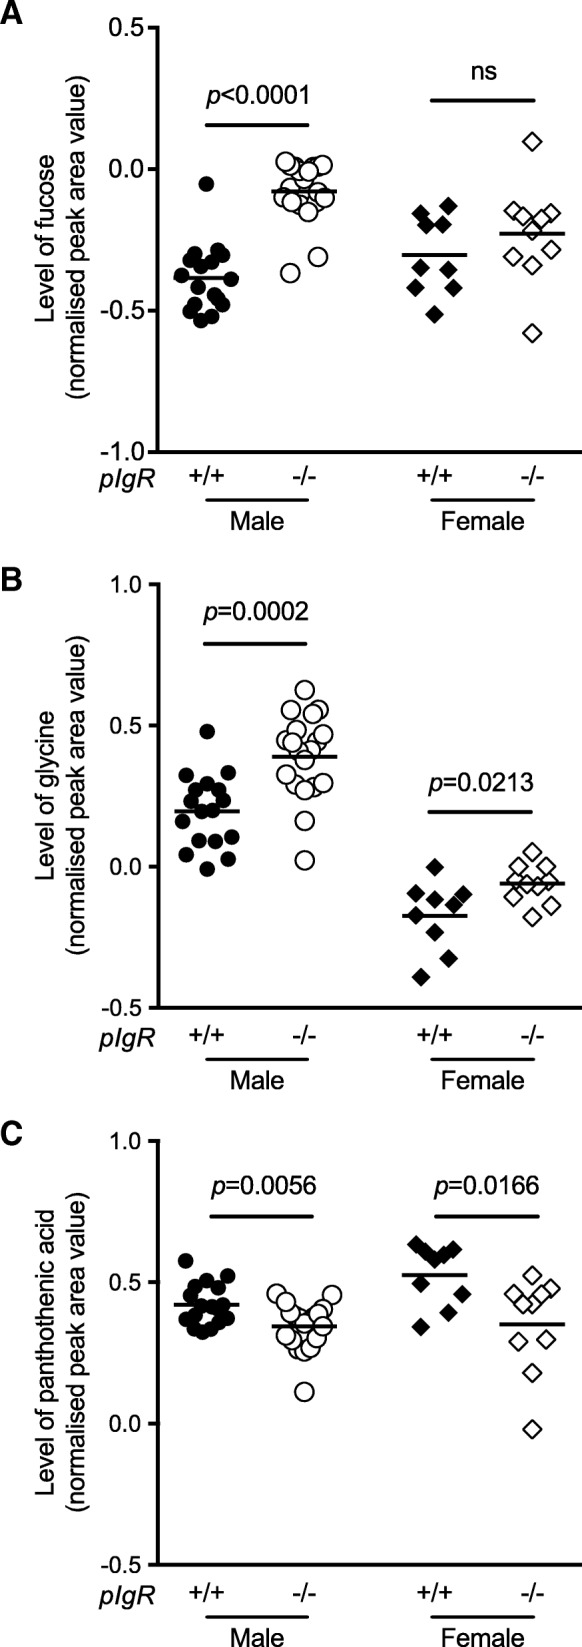
Fig. 5.

Specific metabolites in the urine of B6 and pIgR−/− mice. GC-MS was performed on samples to determine the profile of metabolites excreted in urine of male (closed circle, B6 n = 17; open circle, pIgR−/− n = 19) and female (closed diamond, B6 n = 9; open diamond, pIgR−/− n = 10) mice. Samples were urease treated, ethanol extracted and analysed by GC-MS with myo-inositol as internal control and individual sugars quantitated using a standard sugar mix to determine response factors. Normalized peak area values are shown for a fucose, b glycine and c pantothenic acid. Unpaired t-test was used for statistical analyses and p-values are shown, ns indicates p-value > 0.05
