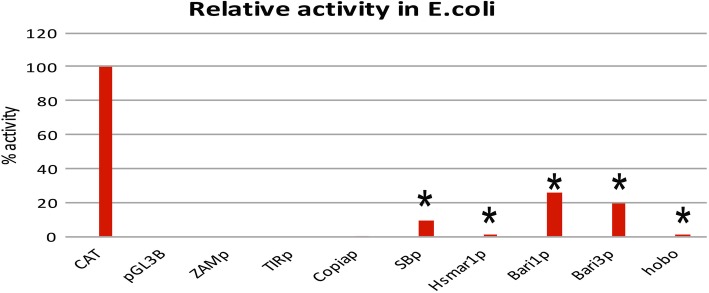
Fig. 5.
Promoter analysis in E. coli cells. Relative promoter activity, expressed as corrected mean RLU values, relative to the positive control (CAT promoter, set to 100) and to the promoter-less construct (set to 0). Promoters with activity significantly different from the promoter-less reporter cassette are marked with an asterisk. Actual values of each experiment set are shown in Additional file 8: Figure S4. The statistical significance of promoter activity against the promoter-less cassette is shown. ***P < 0.001

