Fig. 3.
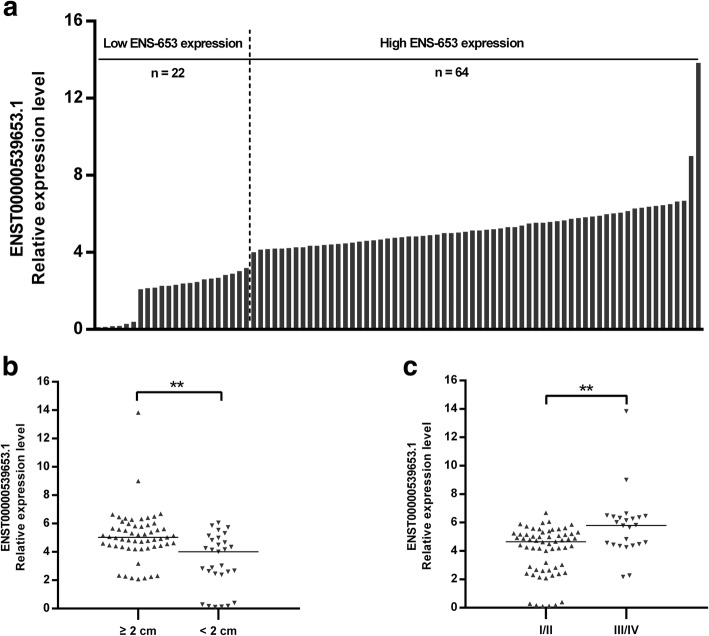
Association of ENS-653 expression with tumor size and stages in PTC patients. a ENS-653 expression was classified into two groups. Final results are presented as fold change in tumor tissues relative to normal tissues. Fold change is greater than or equal to 2.0 for high expression, and less than 2.0 for low expression. b, c ENS-653 upregulation was associated with larger tumor size and advanced stages. Data are expressed as median, **P < 0.01

