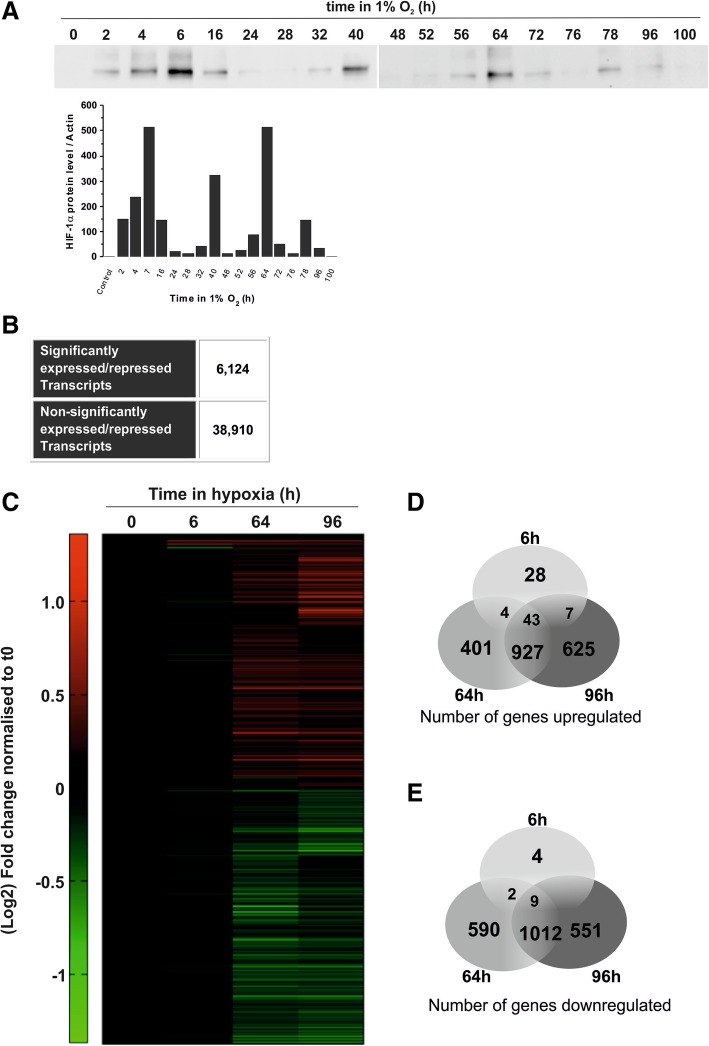
Fig. 3.
Hypoxia induces transcriptional remodelling. (a) D283-MED cells were incubated in 1% O2 for 0–100 h or 21% O2 as a control. The induction HIF-1α levels were measured by western blot. Data shown are representative of 2 independent experiments. (b) Number of significantly expressed or repressed transcripts in hypoxic time points, where significance represents transcripts which have either p < 0.01 for all 3 probes, or p < 0.0001 for 2 out of 3 probes, as well as a minimum of 2-fold change compared to normoxic control. (c) Clustered heat map representing the gene expression profile of D283-MED cells in hypoxia, where cells were incubated for 0, 6, 64 and 96 h at 1% O2. Green and red represent downregulation and upregulation respectively. Venn diagram depicting the number of (d) upregulated and (e) downregulated transcripts in D283-MED at each hypoxic time point

