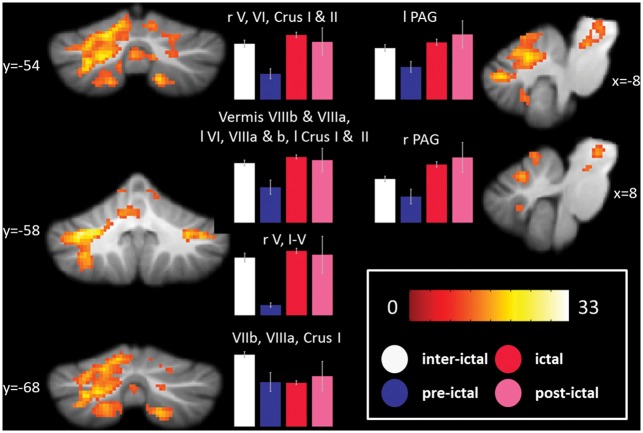
Figure 5.
Results of the ANOVA testing the co-modulation of current migraine phase and BOLD response to trigeminal nociceptive input. The color bar reflects F values at a threshold of p < 0.05, voxel-wise FWE-corrected. The bar plots show average signal changes of the indicated clusters separate for the phases of the migraine with error bars signifying the standard error of the mean. ANOVA: analysis of variance; BOLD: blood oxygenation level dependent; FWE: family-wise error.

