
Figure 4.
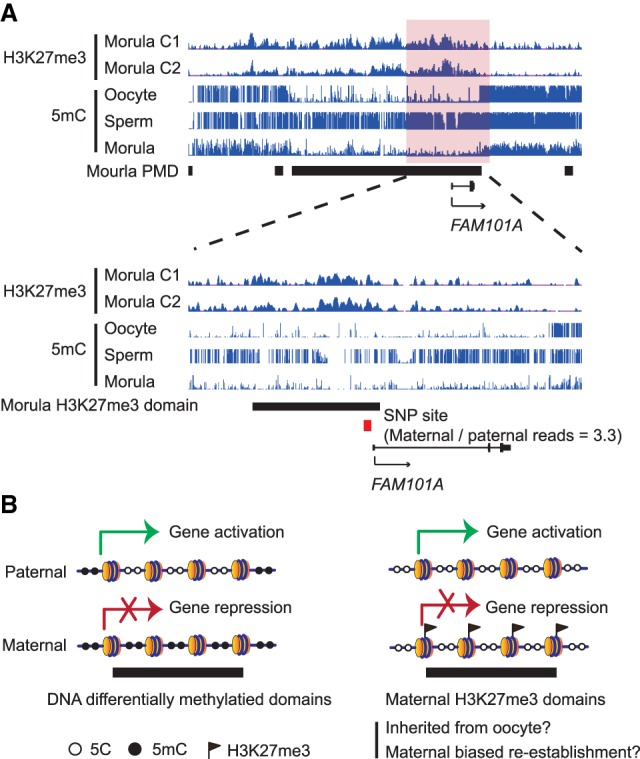
Putative H3K27m3 associated PEGs and proposed model for mechanisms underlying paternal-biased expression. (A) A genome browser view showing H3K27me3 enrichment in morula and DNA methylation levels in oocyte, sperm, and morula at FAM101A locus. Red square represents the SNP identified from H3K27me3 CUT&RUN data. (B) Schematic model showing paternal allelic gene expression can be regulated by either allelic DNA methylation or allelic H3K27me3 in human morulae.