Figure 4.
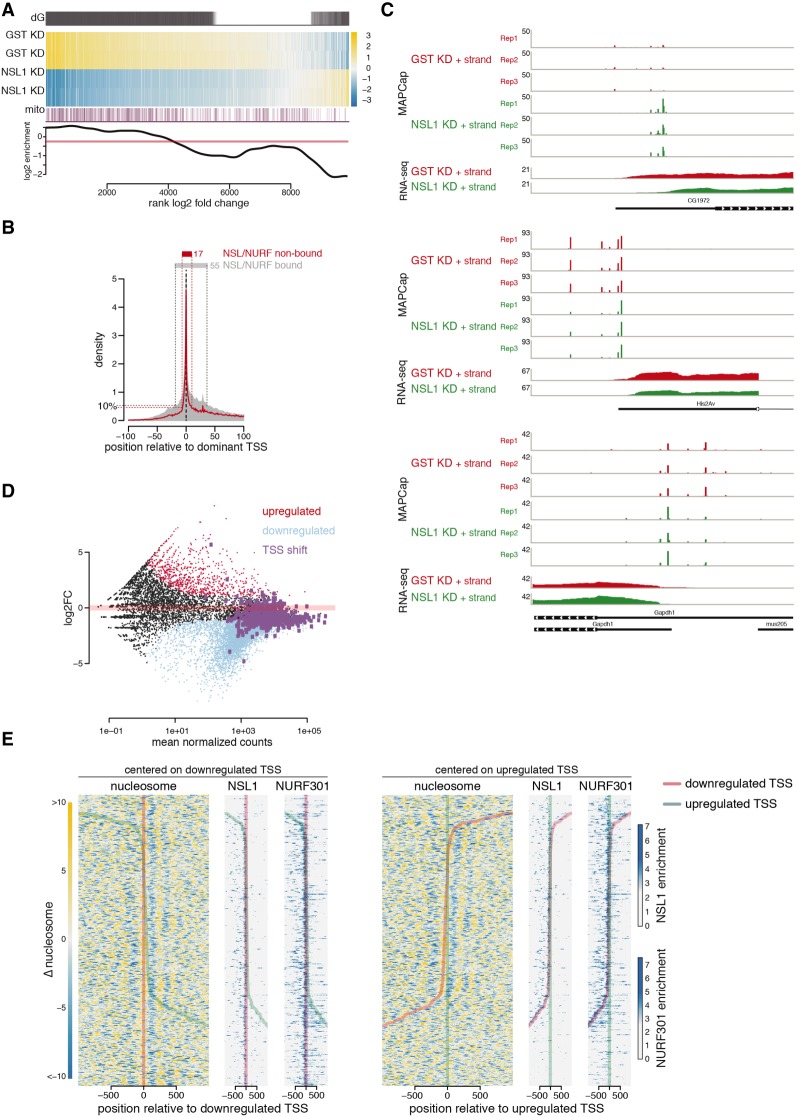
The NSL complex is required for TSS selection. (A) (dG) Differentially expressed genes as defined by DESeq2. (Heat map) Gene expression changes in control (GST) and NSL1-depleted cells; yellow and blue indicate up-regulation and down-regulation, respectively, compared with the average of all samples. (mito) Mitochondrial genes are marked as purple lines. (Bottom) The log2 enrichment of mitochondrial genes over the transcriptome as background. (B) The TSS signal obtained from MAPCap is plotted for NSL-bound (gray area) and non-NSL-bound (red line) genes. Signals for each gene are centered around the dominant TSS. The 10 percentile of signal accumulates within 17 bp from the dominant TSS for the NSL-nonbound genes, whereas the 10 percentile is spread across 55 bp for the NSL-bound genes. (C) Representative examples showing the MAPCap and RNA-seq data for the control (GST; red tracks) and NSL1 knockdown (green tracks). (D) MA plot showing the changes in gene expression upon NSL1 depletion. Light blue denotes down-regulated genes, whereas red denotes up-regulated genes. Genes displaying shifts in TSS selection upon NSL1 knockdown are marked in purple. (E) Heat maps showing change in nucleosome occupancy for genes displaying TSS shift in NSL1 knockdown, with yellow indicating an increase and blue a decrease in nucleosome signal. For each gene with a TSS shift event, one TSS of the gene is defined as down-regulated (red line in both heat maps), whereas another TSS of the same gene is labeled as up-regulated (green line) in the same gene. The left heat maps are centered at the down-regulated TSS (red). Heat maps on the right are centered at the up-regulated TSS (green). NSL1 and NURF301 ChIP-seq signals are shown for these 418 genes.

