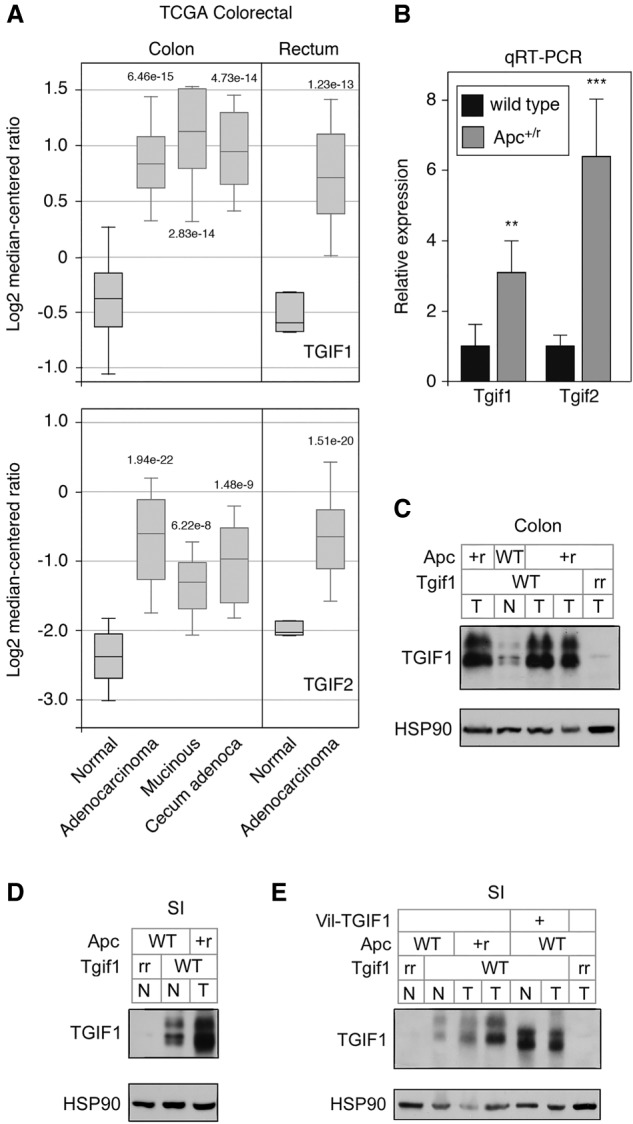
Figure 1.

Increased expression of Tgifs in intestine tumors. (A) Log2 median centered expression data for TGIF1 and TGIF2 in the TCGA colorectal data set (analysis from Oncomine, with upper and lower quartiles and 10th and 90th percentiles), for normal and the indicated tumor types. P-values for comparisons with normal are shown. (B) Relative Tgif1 and Tgif2 expression (mean + SD of quadruplicate samples) determined by qRT-PCR, from wild-type (normal) colon or from Apc mutant colon tumors. (**) P < 0.01; (***) P < 0.001; (****) P < 0.0001. (C) Expression of Tgif1 was analyzed by Western blot (with Hsp90 as a loading control) from normal colon (N) and tumor (T) from tissue of the indicated genotypes. (+) Wild type; (r) recombined allele. (D) Tgif1 expression from the small intestine (normal or tumor, as in C). (E) Expression of Tgif1 in normal (N) and tumor (T) tissue from mice of the indicated genotypes is shown by western blot with a TGIF1-specific antiserum and HSP90 as a loading control. Note the transgenic TGIF1 migrates slightly faster than the endogenous mouse Tgif1.
