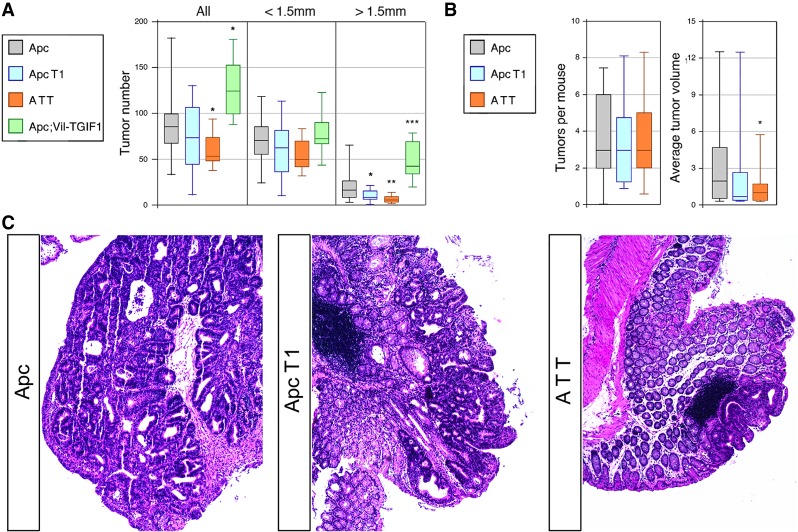
Figure 2.
Tgif expression promotes intestinal tumorigenesis. (A) The numbers of tumors per animal (at 12 wk) in the small intestine are shown (median, upper, and lower quartiles, 5th and 95th percentiles) for each genotype. Numbers are shown for all tumors and separately for those <1.5 mm or >1.5 mm in diameter. P-values for comparison with the Apc+/r mice are shown. (B) Number of colon tumors per mouse and tumor volume in mm3 are shown (median, upper, and lower quartiles, 5th and 95th percentiles). P-values for comparison with the Apc+/r mice are shown. (*) P < 0.05; (**) P < 0.01; (***) P < 0.001. (C) Representative images of hematoxylin and eosin (H&E)-stained colon tumors from the indicated genotypes are shown. Images were captured at 200× magnification.

