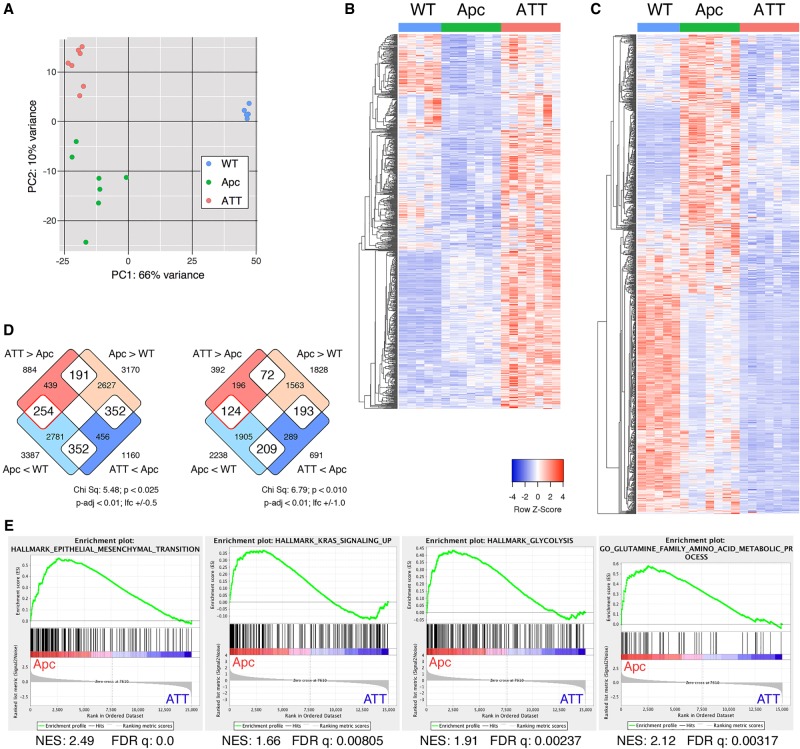
Figure 3.
Gene expression changes in Tgif mutant colon tumors. (A) Principle component analysis of RNA sequencing (RNA-seq) data from normal wild-type mouse colon or from colon tumors isolated from Apc heterozygous mice (Apc) or Apc heterozygous mice with homozygous deletion of both Tgif1 and Tgif2 (ATT). Heat maps are shown for all genes with significantly (log2 fold change > 0.5, P-adjusted < 0.01) higher (B) or lower (C) expression in ATT than in Apc. (D) Venn diagrams indicating the overlap between genes that are significantly differently expressed between Apc versus wild-type and Apc versus ATT. (E) Gene set enrichment analysis (GSEA) indicates enrichment of epithelial-to-mesenchymal transition (EMT), KRAS signaling, glycolysis, and glutamine metabolism in Apc tumors compared with ATT. The nominal enrichment score (NES) and false discovery rate q-value are shown.

