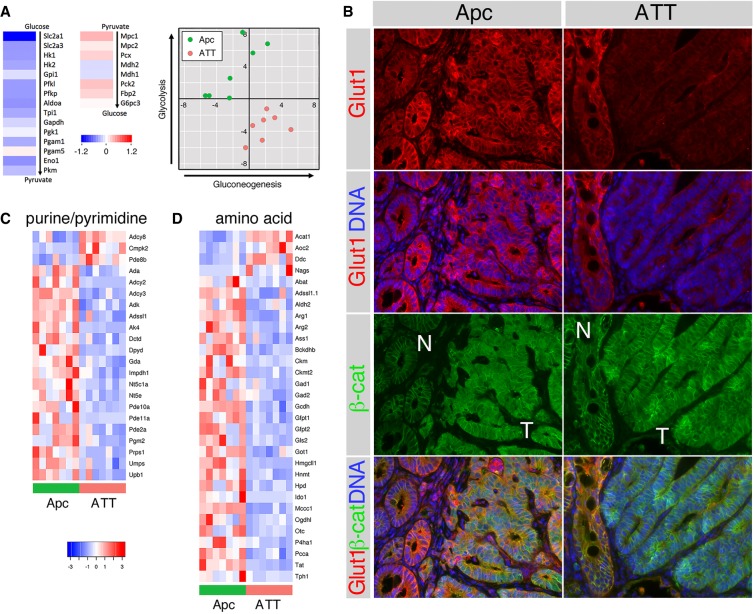
Figure 4.
Altered metabolic gene expression in Tgif mutant colon tumors. (A) Heat maps are shown indicating fold-change (comparing ATT with Apc tumors) for the glycolytic pathway and for genes involved specifically in the conversion of pyruvate to glucose. The plot to the right shows summed Z-scores for a panel of genes involved only in glycolysis or in gluconeogenesis, plotted as gluconeogenesis versus glycolysis for each tumor. (B) IF analysis is shown for Glut1 and β-catenin in colon tumors (T) with adjacent normal tissue (N). Heat maps are shown for all genes in the purine and pyrimidine metabolic pathways (C) or amino acid metabolic pathways (D) that are significantly differently expressed comparing Apc with ATT tumors.

