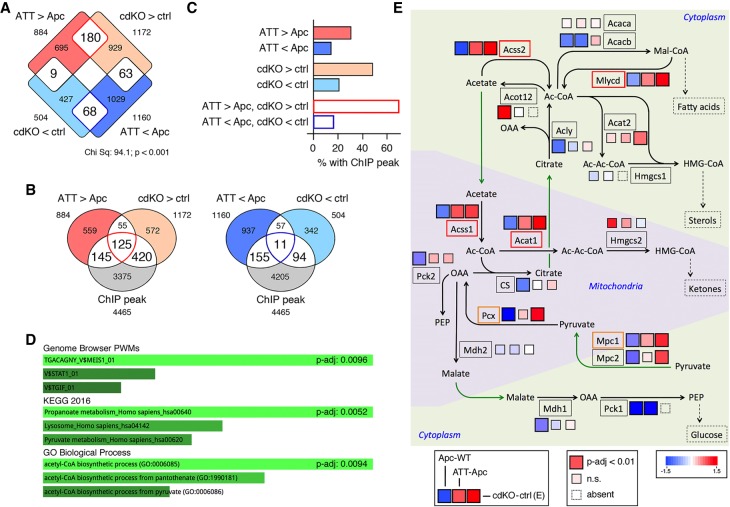
Figure 5.
Identification of putative Tgif target genes. (A) Differentially expressed genes from RNA-seq data from control or Tgif1;Tgif2-null (cdKO) day 9 mouse embryos (GSE78728) overlapped with genes that are significantly differently expressed in ATT versus Apc tumors. (B) Genes with significantly higher (left) or lower (right) expression in either dataset were overlapped with Tgif1 ChIP-seq data from mouse ES cells (GSE55404). (C) The percentage of genes from each of the indicated overlaps between expression data from embryos and tumors with ChIP-seq peaks is shown. (D) EnrichR analysis of the 125 genes with increased expression in embryos and tumors that also have ChIP-seq peaks is shown. (E) A pathway map for selected genes involved in acetyl CoA and pyruvate metabolism is shown, with mitochondrial and cytoplasmic compartments shown separately. Black arrows indicate metabolic reactions, green arrows translocations, and the dashed arrows links to additional metabolic pathways. For each gene shown (boxed), the three colored squares represent fold changes in comparisons of Apc with wild-type (left), ATT with Apc tumor (center), and cdKO with control embryo (right). Larger boxes indicate significant change (P-adjusted < 0.01). Smaller boxes are not significant at this cutoff.

