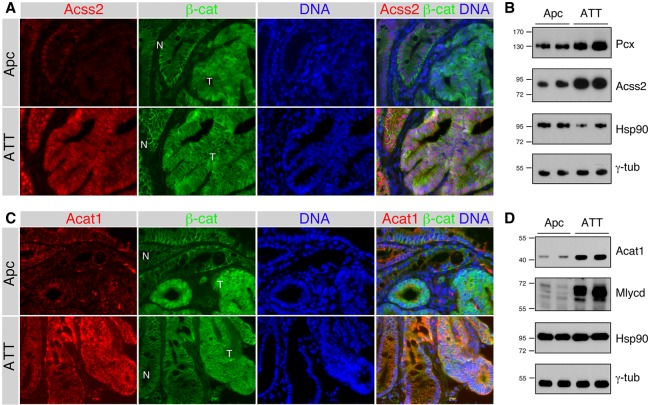
Figure 6.
Increased Acss2 expression in Tgif mutant tumors. (A) IF analysis is shown for Acss2 and β-catenin in colon tumors (T) with adjacent normal (N) tissue from Apc mutants and ATT mice. (B) Western blot analysis of colon tumors from Apc and ATT mice showing expression of Acss2 and Pcx, together with Hsp90 and γ-tubulin loading controls. (C) IF analysis is shown for Acat1 and β-catenin in colon tumors with adjacent normal tissue from Apc and ATT mice. (D) Western blot analysis of Apc and ATT colon tumors showing expression of Acat1 and Mlycd, together with Hsp90 and γ-tubulin loading controls. Molecular weight markers are shown for B and D.

