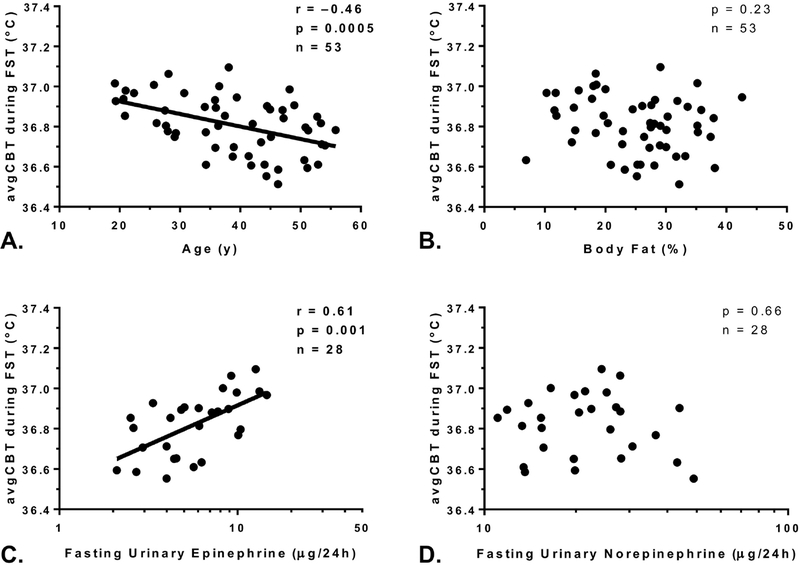
Figure 2. Determinants of CBT.
The mean 24-h core body temperature (avgCBT) was negatively associated with age (Panel A) but did not correlate with percentage body fat (Panel B). The avgCBT during fasting (FST) was positively correlated with urinary epinephrine, shown in log10-scale on the x-axis (Panel C), but not with urinary norepinephrine (Panel D).

